Immigrants from Liberia vs Immigrants from Asia 3 or more Vehicles in Household
COMPARE
Immigrants from Liberia
Immigrants from Asia
3 or more Vehicles in Household
3 or more Vehicles in Household Comparison
Immigrants from Liberia
Immigrants from Asia
17.1%
3 OR MORE VEHICLES IN HOUSEHOLD
0.1/ 100
METRIC RATING
289th/ 347
METRIC RANK
20.2%
3 OR MORE VEHICLES IN HOUSEHOLD
88.1/ 100
METRIC RATING
131st/ 347
METRIC RANK
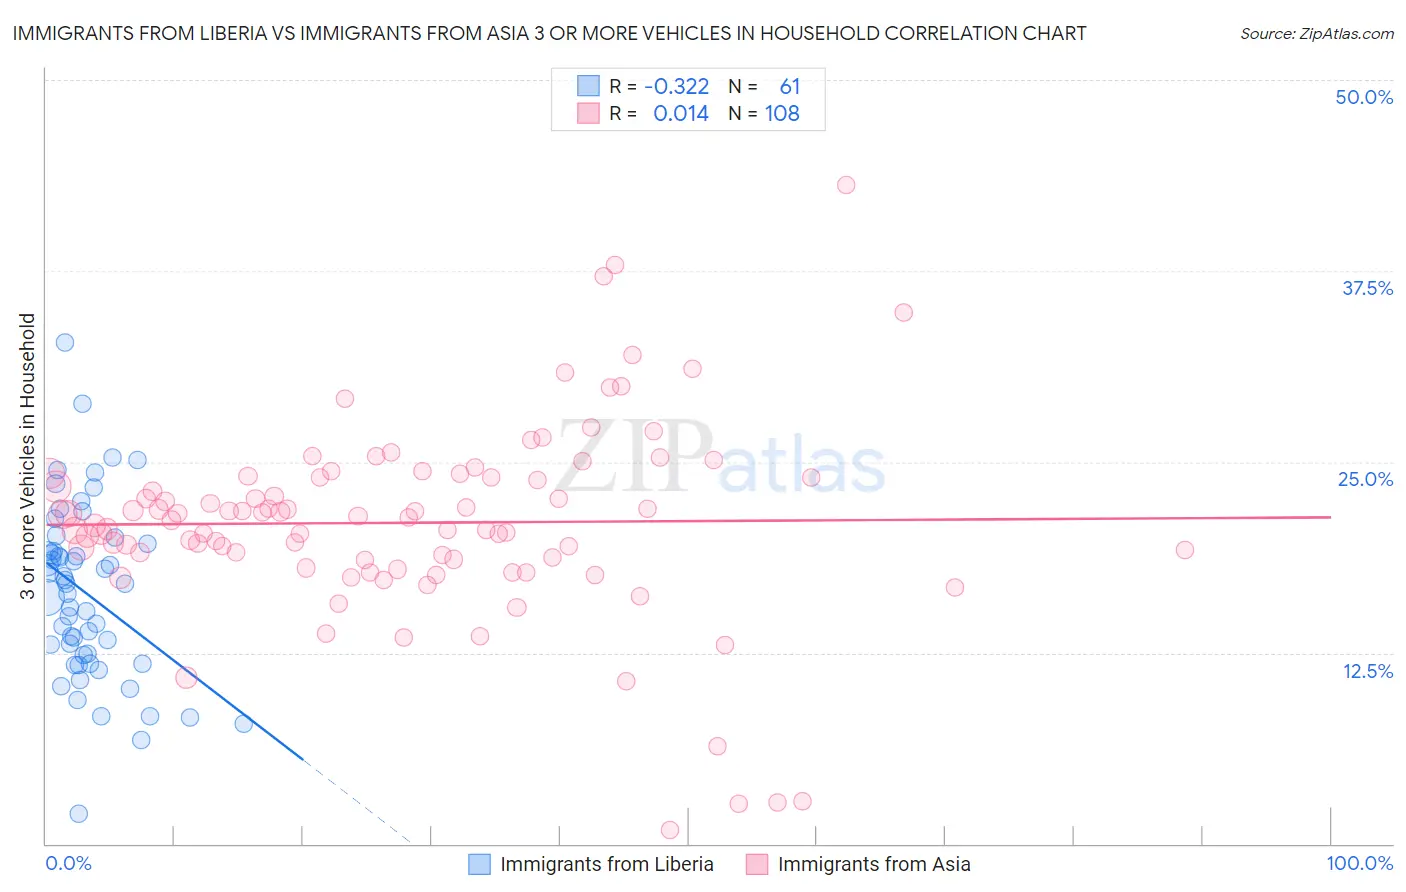
Immigrants from Liberia vs Immigrants from Asia 3 or more Vehicles in Household Correlation Chart
The statistical analysis conducted on geographies consisting of 135,209,335 people shows a mild negative correlation between the proportion of Immigrants from Liberia and percentage of households with 3 or more vehicles available in the United States with a correlation coefficient (R) of -0.322 and weighted average of 17.1%. Similarly, the statistical analysis conducted on geographies consisting of 548,260,501 people shows no correlation between the proportion of Immigrants from Asia and percentage of households with 3 or more vehicles available in the United States with a correlation coefficient (R) of 0.014 and weighted average of 20.2%, a difference of 18.4%.
3 or more Vehicles in Household Correlation Summary
| Measurement | Immigrants from Liberia | Immigrants from Asia |
| Minimum | 2.0% | 0.88% |
| Maximum | 32.8% | 43.1% |
| Range | 30.9% | 42.3% |
| Mean | 16.4% | 21.0% |
| Median | 17.0% | 21.3% |
| Interquartile 25% (IQ1) | 12.1% | 18.6% |
| Interquartile 75% (IQ3) | 19.4% | 24.0% |
| Interquartile Range (IQR) | 7.3% | 5.4% |
| Standard Deviation (Sample) | 5.7% | 6.5% |
| Standard Deviation (Population) | 5.7% | 6.4% |
Similar Demographics by 3 or more Vehicles in Household
Demographics Similar to Immigrants from Liberia by 3 or more Vehicles in Household
In terms of 3 or more vehicles in household, the demographic groups most similar to Immigrants from Liberia are Immigrants from Uruguay (17.1%, a difference of 0.070%), Immigrants from Brazil (17.1%, a difference of 0.16%), Menominee (17.2%, a difference of 0.46%), Immigrants from Croatia (17.2%, a difference of 0.52%), and Liberian (17.0%, a difference of 0.57%).
| Demographics | Rating | Rank | 3 or more Vehicles in Household |
| Immigrants | Ireland | 0.3 /100 | #282 | Tragic 17.3% |
| Blacks/African Americans | 0.3 /100 | #283 | Tragic 17.3% |
| Immigrants | Colombia | 0.3 /100 | #284 | Tragic 17.3% |
| Immigrants | Croatia | 0.2 /100 | #285 | Tragic 17.2% |
| Menominee | 0.2 /100 | #286 | Tragic 17.2% |
| Immigrants | Brazil | 0.2 /100 | #287 | Tragic 17.1% |
| Immigrants | Uruguay | 0.2 /100 | #288 | Tragic 17.1% |
| Immigrants | Liberia | 0.1 /100 | #289 | Tragic 17.1% |
| Liberians | 0.1 /100 | #290 | Tragic 17.0% |
| Immigrants | Congo | 0.1 /100 | #291 | Tragic 17.0% |
| Immigrants | Spain | 0.1 /100 | #292 | Tragic 17.0% |
| Bahamians | 0.1 /100 | #293 | Tragic 16.9% |
| Immigrants | Western Africa | 0.1 /100 | #294 | Tragic 16.9% |
| Immigrants | Russia | 0.1 /100 | #295 | Tragic 16.9% |
| Inupiat | 0.1 /100 | #296 | Tragic 16.9% |
Demographics Similar to Immigrants from Asia by 3 or more Vehicles in Household
In terms of 3 or more vehicles in household, the demographic groups most similar to Immigrants from Asia are Immigrants from Canada (20.2%, a difference of 0.050%), Immigrants from North America (20.2%, a difference of 0.050%), Greek (20.3%, a difference of 0.070%), Zimbabwean (20.3%, a difference of 0.10%), and Polish (20.2%, a difference of 0.14%).
| Demographics | Rating | Rank | 3 or more Vehicles in Household |
| Central Americans | 93.1 /100 | #124 | Exceptional 20.5% |
| Immigrants | Netherlands | 92.9 /100 | #125 | Exceptional 20.4% |
| Slavs | 92.1 /100 | #126 | Exceptional 20.4% |
| Immigrants | Bolivia | 92.0 /100 | #127 | Exceptional 20.4% |
| New Zealanders | 91.3 /100 | #128 | Exceptional 20.4% |
| Zimbabweans | 88.7 /100 | #129 | Excellent 20.3% |
| Greeks | 88.6 /100 | #130 | Excellent 20.3% |
| Immigrants | Asia | 88.1 /100 | #131 | Excellent 20.2% |
| Immigrants | Canada | 87.8 /100 | #132 | Excellent 20.2% |
| Immigrants | North America | 87.8 /100 | #133 | Excellent 20.2% |
| Poles | 87.3 /100 | #134 | Excellent 20.2% |
| Immigrants | India | 87.2 /100 | #135 | Excellent 20.2% |
| Immigrants | Nicaragua | 87.1 /100 | #136 | Excellent 20.2% |
| Immigrants | Iraq | 87.1 /100 | #137 | Excellent 20.2% |
| Aleuts | 86.3 /100 | #138 | Excellent 20.2% |