Immigrants from Liberia vs Immigrants from Yemen 3 or more Vehicles in Household
COMPARE
Immigrants from Liberia
Immigrants from Yemen
3 or more Vehicles in Household
3 or more Vehicles in Household Comparison
Immigrants from Liberia
Immigrants from Yemen
17.1%
3 OR MORE VEHICLES IN HOUSEHOLD
0.1/ 100
METRIC RATING
289th/ 347
METRIC RANK
14.2%
3 OR MORE VEHICLES IN HOUSEHOLD
0.0/ 100
METRIC RATING
324th/ 347
METRIC RANK
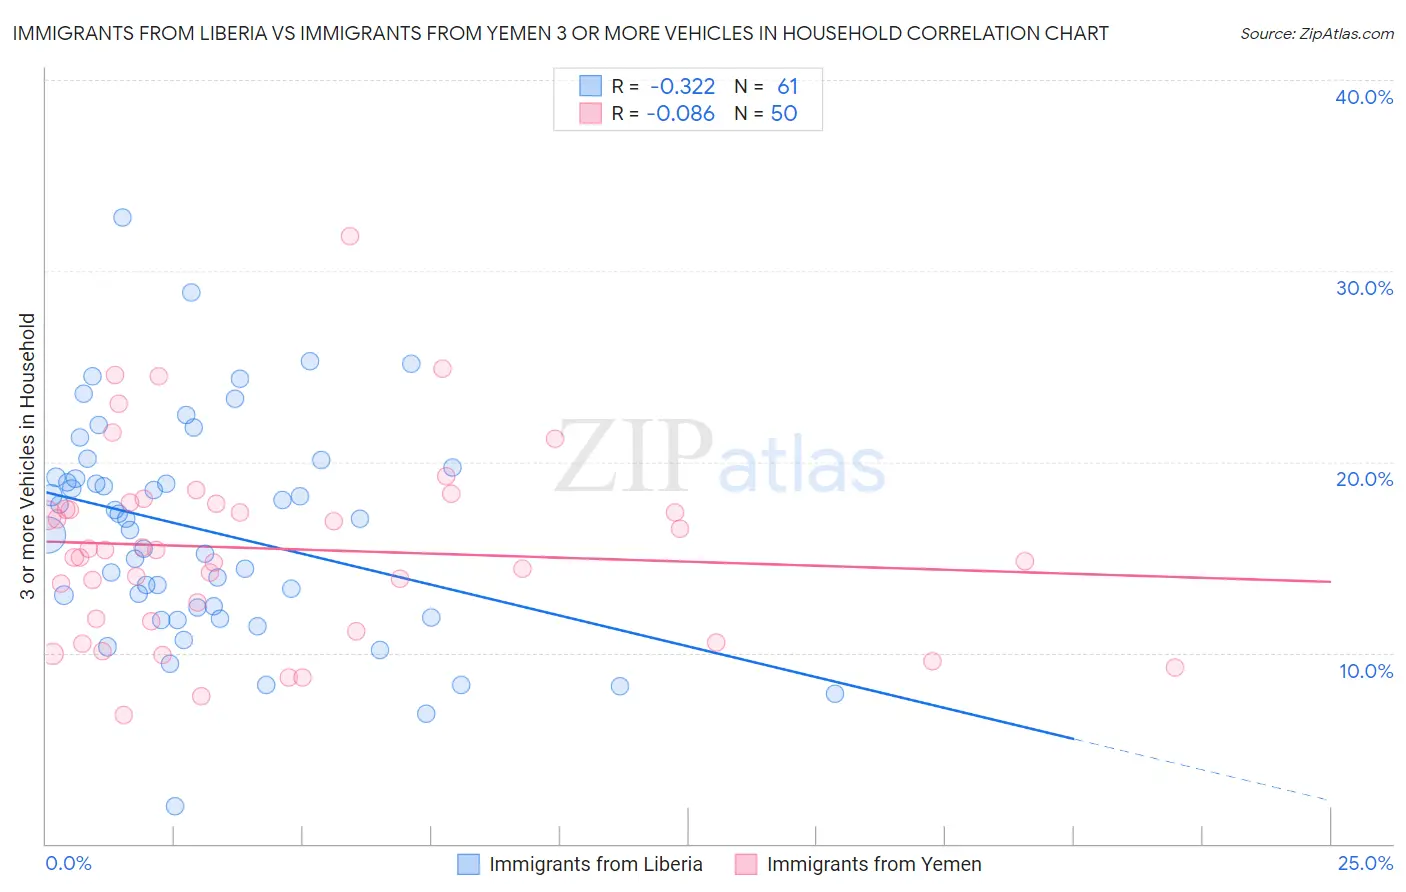
Immigrants from Liberia vs Immigrants from Yemen 3 or more Vehicles in Household Correlation Chart
The statistical analysis conducted on geographies consisting of 135,209,335 people shows a mild negative correlation between the proportion of Immigrants from Liberia and percentage of households with 3 or more vehicles available in the United States with a correlation coefficient (R) of -0.322 and weighted average of 17.1%. Similarly, the statistical analysis conducted on geographies consisting of 82,431,124 people shows a slight negative correlation between the proportion of Immigrants from Yemen and percentage of households with 3 or more vehicles available in the United States with a correlation coefficient (R) of -0.086 and weighted average of 14.2%, a difference of 20.1%.
3 or more Vehicles in Household Correlation Summary
| Measurement | Immigrants from Liberia | Immigrants from Yemen |
| Minimum | 2.0% | 6.7% |
| Maximum | 32.8% | 31.8% |
| Range | 30.9% | 25.1% |
| Mean | 16.4% | 15.5% |
| Median | 17.0% | 15.2% |
| Interquartile 25% (IQ1) | 12.1% | 11.6% |
| Interquartile 75% (IQ3) | 19.4% | 17.8% |
| Interquartile Range (IQR) | 7.3% | 6.1% |
| Standard Deviation (Sample) | 5.7% | 5.0% |
| Standard Deviation (Population) | 5.7% | 5.0% |
Similar Demographics by 3 or more Vehicles in Household
Demographics Similar to Immigrants from Liberia by 3 or more Vehicles in Household
In terms of 3 or more vehicles in household, the demographic groups most similar to Immigrants from Liberia are Immigrants from Uruguay (17.1%, a difference of 0.070%), Immigrants from Brazil (17.1%, a difference of 0.16%), Menominee (17.2%, a difference of 0.46%), Immigrants from Croatia (17.2%, a difference of 0.52%), and Liberian (17.0%, a difference of 0.57%).
| Demographics | Rating | Rank | 3 or more Vehicles in Household |
| Immigrants | Ireland | 0.3 /100 | #282 | Tragic 17.3% |
| Blacks/African Americans | 0.3 /100 | #283 | Tragic 17.3% |
| Immigrants | Colombia | 0.3 /100 | #284 | Tragic 17.3% |
| Immigrants | Croatia | 0.2 /100 | #285 | Tragic 17.2% |
| Menominee | 0.2 /100 | #286 | Tragic 17.2% |
| Immigrants | Brazil | 0.2 /100 | #287 | Tragic 17.1% |
| Immigrants | Uruguay | 0.2 /100 | #288 | Tragic 17.1% |
| Immigrants | Liberia | 0.1 /100 | #289 | Tragic 17.1% |
| Liberians | 0.1 /100 | #290 | Tragic 17.0% |
| Immigrants | Congo | 0.1 /100 | #291 | Tragic 17.0% |
| Immigrants | Spain | 0.1 /100 | #292 | Tragic 17.0% |
| Bahamians | 0.1 /100 | #293 | Tragic 16.9% |
| Immigrants | Western Africa | 0.1 /100 | #294 | Tragic 16.9% |
| Immigrants | Russia | 0.1 /100 | #295 | Tragic 16.9% |
| Inupiat | 0.1 /100 | #296 | Tragic 16.9% |
Demographics Similar to Immigrants from Yemen by 3 or more Vehicles in Household
In terms of 3 or more vehicles in household, the demographic groups most similar to Immigrants from Yemen are Senegalese (14.2%, a difference of 0.080%), Soviet Union (14.2%, a difference of 0.41%), Ecuadorian (14.1%, a difference of 1.3%), Immigrants from Albania (14.0%, a difference of 2.0%), and Immigrants from Caribbean (14.6%, a difference of 2.3%).
| Demographics | Rating | Rank | 3 or more Vehicles in Household |
| Jamaicans | 0.0 /100 | #317 | Tragic 15.2% |
| Immigrants | Haiti | 0.0 /100 | #318 | Tragic 15.2% |
| Cape Verdeans | 0.0 /100 | #319 | Tragic 15.0% |
| Yup'ik | 0.0 /100 | #320 | Tragic 14.8% |
| Immigrants | Jamaica | 0.0 /100 | #321 | Tragic 14.7% |
| Immigrants | West Indies | 0.0 /100 | #322 | Tragic 14.6% |
| Immigrants | Caribbean | 0.0 /100 | #323 | Tragic 14.6% |
| Immigrants | Yemen | 0.0 /100 | #324 | Tragic 14.2% |
| Senegalese | 0.0 /100 | #325 | Tragic 14.2% |
| Soviet Union | 0.0 /100 | #326 | Tragic 14.2% |
| Ecuadorians | 0.0 /100 | #327 | Tragic 14.1% |
| Immigrants | Albania | 0.0 /100 | #328 | Tragic 14.0% |
| Immigrants | Senegal | 0.0 /100 | #329 | Tragic 13.8% |
| West Indians | 0.0 /100 | #330 | Tragic 13.7% |
| Immigrants | Dominica | 0.0 /100 | #331 | Tragic 13.7% |