Immigrants from Liberia vs Comanche Single Mother Poverty
COMPARE
Immigrants from Liberia
Comanche
Single Mother Poverty
Single Mother Poverty Comparison
Immigrants from Liberia
Comanche
30.1%
SINGLE MOTHER POVERTY
5.9/ 100
METRIC RATING
227th/ 347
METRIC RANK
33.9%
SINGLE MOTHER POVERTY
0.0/ 100
METRIC RATING
307th/ 347
METRIC RANK
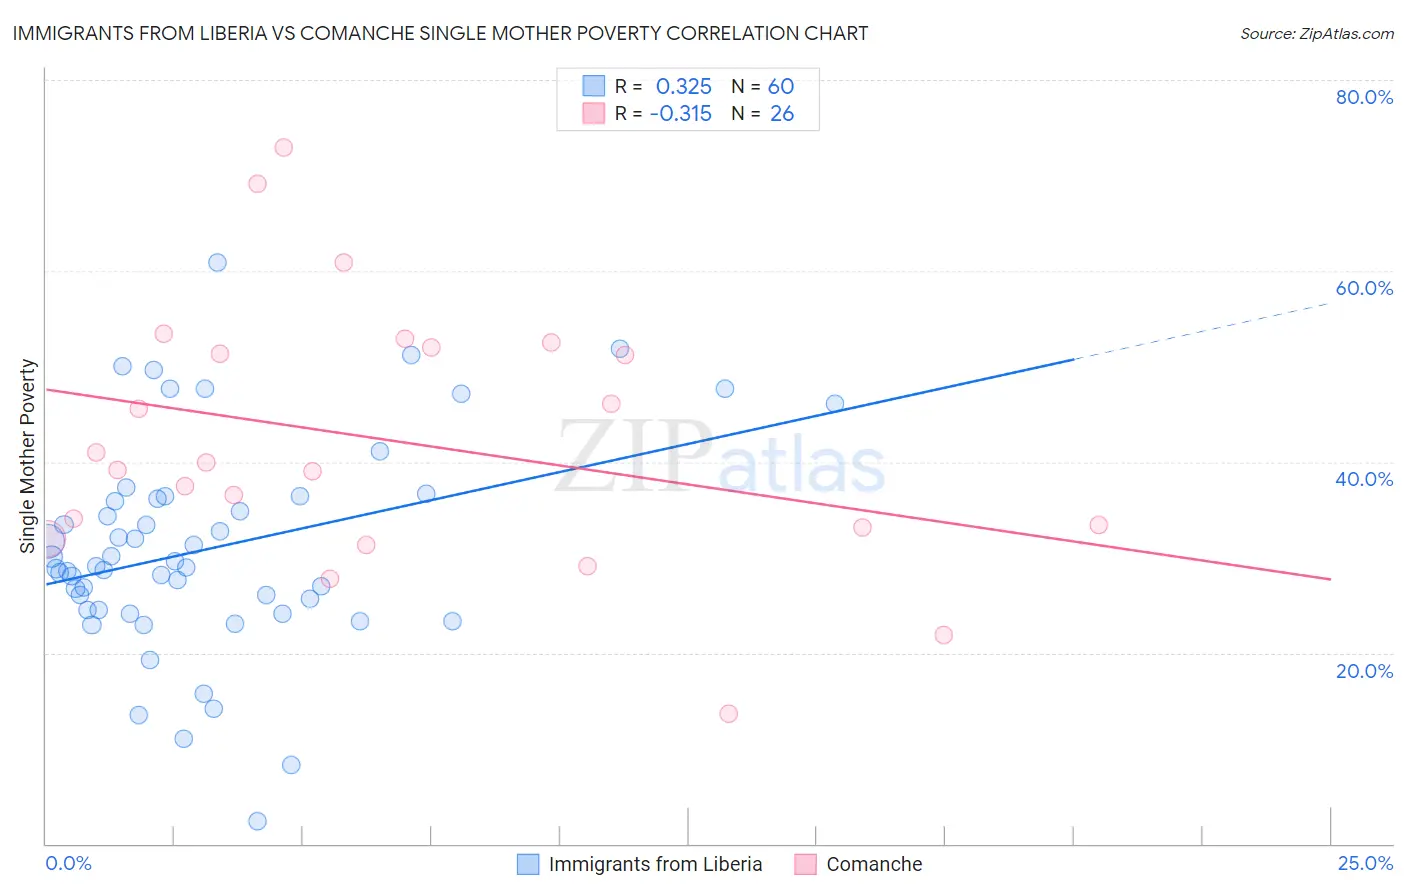
Immigrants from Liberia vs Comanche Single Mother Poverty Correlation Chart
The statistical analysis conducted on geographies consisting of 134,572,167 people shows a mild positive correlation between the proportion of Immigrants from Liberia and poverty level among single mothers in the United States with a correlation coefficient (R) of 0.325 and weighted average of 30.1%. Similarly, the statistical analysis conducted on geographies consisting of 109,063,480 people shows a mild negative correlation between the proportion of Comanche and poverty level among single mothers in the United States with a correlation coefficient (R) of -0.315 and weighted average of 33.9%, a difference of 12.6%.
Single Mother Poverty Correlation Summary
| Measurement | Immigrants from Liberia | Comanche |
| Minimum | 2.4% | 13.6% |
| Maximum | 60.9% | 73.0% |
| Range | 58.5% | 59.3% |
| Mean | 30.9% | 42.2% |
| Median | 29.0% | 39.6% |
| Interquartile 25% (IQ1) | 24.5% | 33.1% |
| Interquartile 75% (IQ3) | 36.2% | 52.0% |
| Interquartile Range (IQR) | 11.7% | 18.9% |
| Standard Deviation (Sample) | 11.3% | 13.9% |
| Standard Deviation (Population) | 11.2% | 13.6% |
Similar Demographics by Single Mother Poverty
Demographics Similar to Immigrants from Liberia by Single Mother Poverty
In terms of single mother poverty, the demographic groups most similar to Immigrants from Liberia are Scottish (30.1%, a difference of 0.030%), Spanish (30.1%, a difference of 0.090%), Spaniard (30.2%, a difference of 0.11%), Immigrants from Sudan (30.1%, a difference of 0.12%), and Immigrants from Cuba (30.1%, a difference of 0.19%).
| Demographics | Rating | Rank | Single Mother Poverty |
| Germans | 8.8 /100 | #220 | Tragic 30.0% |
| Immigrants | Eritrea | 7.7 /100 | #221 | Tragic 30.0% |
| Sudanese | 7.6 /100 | #222 | Tragic 30.0% |
| Immigrants | Cuba | 6.9 /100 | #223 | Tragic 30.1% |
| Immigrants | Sudan | 6.5 /100 | #224 | Tragic 30.1% |
| Spanish | 6.3 /100 | #225 | Tragic 30.1% |
| Scottish | 6.0 /100 | #226 | Tragic 30.1% |
| Immigrants | Liberia | 5.9 /100 | #227 | Tragic 30.1% |
| Spaniards | 5.4 /100 | #228 | Tragic 30.2% |
| Immigrants | Barbados | 5.0 /100 | #229 | Tragic 30.2% |
| English | 4.8 /100 | #230 | Tragic 30.2% |
| Dutch | 4.3 /100 | #231 | Tragic 30.2% |
| Alaskan Athabascans | 4.1 /100 | #232 | Tragic 30.3% |
| Immigrants | Middle Africa | 3.5 /100 | #233 | Tragic 30.3% |
| Immigrants | Nicaragua | 3.5 /100 | #234 | Tragic 30.3% |
Demographics Similar to Comanche by Single Mother Poverty
In terms of single mother poverty, the demographic groups most similar to Comanche are Immigrants from Mexico (34.0%, a difference of 0.18%), Immigrants from Congo (33.8%, a difference of 0.41%), Potawatomi (34.1%, a difference of 0.60%), Honduran (34.2%, a difference of 0.82%), and Immigrants from Central America (33.6%, a difference of 1.1%).
| Demographics | Rating | Rank | Single Mother Poverty |
| Hispanics or Latinos | 0.0 /100 | #300 | Tragic 33.3% |
| Immigrants | Somalia | 0.0 /100 | #301 | Tragic 33.4% |
| Arapaho | 0.0 /100 | #302 | Tragic 33.4% |
| Americans | 0.0 /100 | #303 | Tragic 33.5% |
| Mexicans | 0.0 /100 | #304 | Tragic 33.6% |
| Immigrants | Central America | 0.0 /100 | #305 | Tragic 33.6% |
| Immigrants | Congo | 0.0 /100 | #306 | Tragic 33.8% |
| Comanche | 0.0 /100 | #307 | Tragic 33.9% |
| Immigrants | Mexico | 0.0 /100 | #308 | Tragic 34.0% |
| Potawatomi | 0.0 /100 | #309 | Tragic 34.1% |
| Hondurans | 0.0 /100 | #310 | Tragic 34.2% |
| Alsatians | 0.0 /100 | #311 | Tragic 34.3% |
| Central American Indians | 0.0 /100 | #312 | Tragic 34.3% |
| Immigrants | Dominican Republic | 0.0 /100 | #313 | Tragic 34.4% |
| Chickasaw | 0.0 /100 | #314 | Tragic 34.4% |