Immigrants from Latin America vs Comanche 3 or more Vehicles in Household
COMPARE
Immigrants from Latin America
Comanche
3 or more Vehicles in Household
3 or more Vehicles in Household Comparison
Immigrants from Latin America
Comanche
20.5%
3 OR MORE VEHICLES IN HOUSEHOLD
94.5/ 100
METRIC RATING
119th/ 347
METRIC RANK
21.0%
3 OR MORE VEHICLES IN HOUSEHOLD
98.2/ 100
METRIC RATING
100th/ 347
METRIC RANK
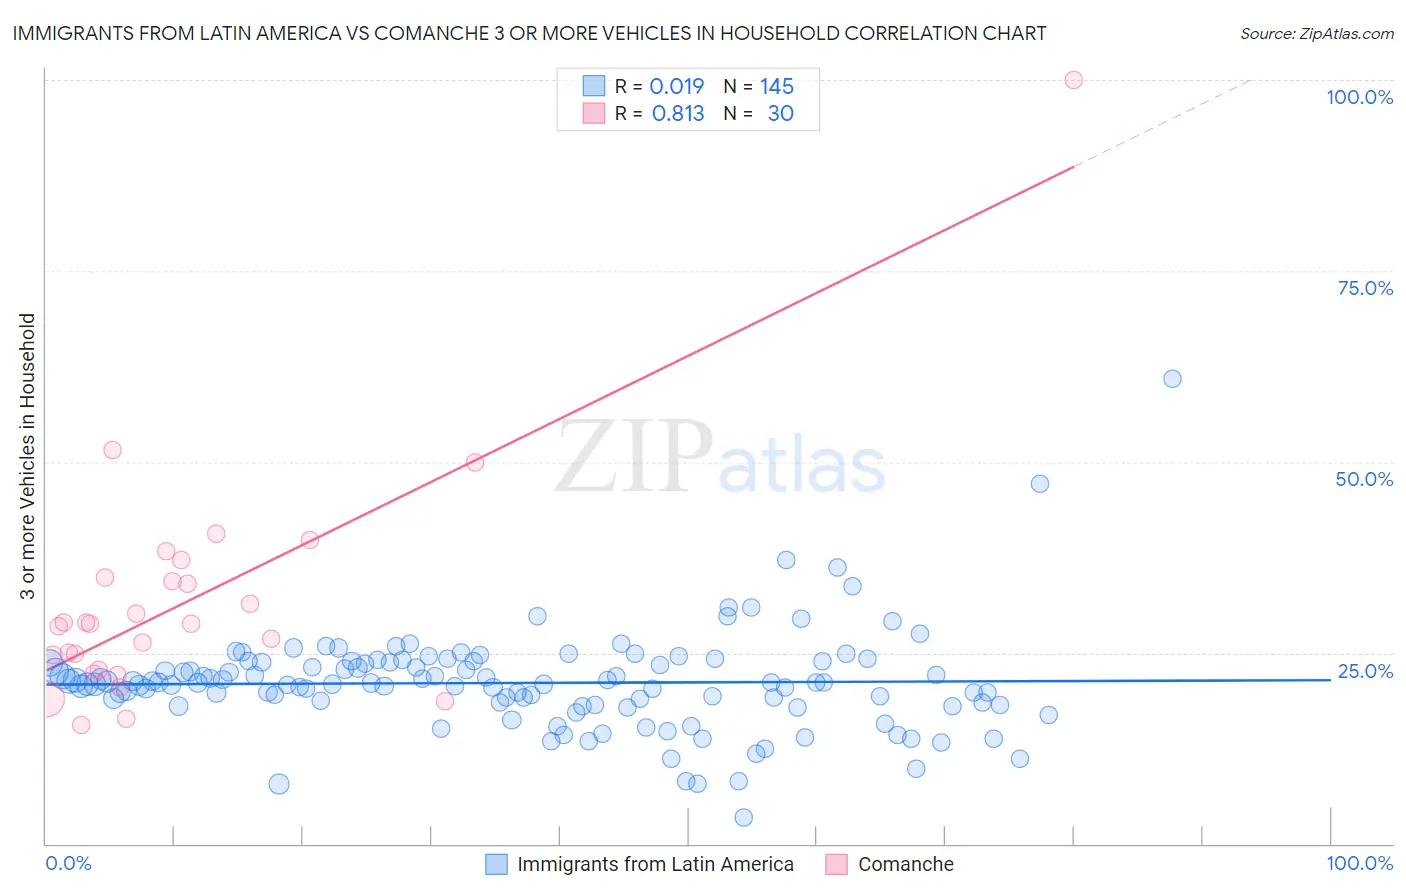
Immigrants from Latin America vs Comanche 3 or more Vehicles in Household Correlation Chart
The statistical analysis conducted on geographies consisting of 557,725,170 people shows no correlation between the proportion of Immigrants from Latin America and percentage of households with 3 or more vehicles available in the United States with a correlation coefficient (R) of 0.019 and weighted average of 20.5%. Similarly, the statistical analysis conducted on geographies consisting of 109,768,043 people shows a very strong positive correlation between the proportion of Comanche and percentage of households with 3 or more vehicles available in the United States with a correlation coefficient (R) of 0.813 and weighted average of 21.0%, a difference of 2.1%.
3 or more Vehicles in Household Correlation Summary
| Measurement | Immigrants from Latin America | Comanche |
| Minimum | 3.4% | 15.6% |
| Maximum | 60.9% | 100.0% |
| Range | 57.5% | 84.4% |
| Mean | 21.1% | 31.7% |
| Median | 21.0% | 28.8% |
| Interquartile 25% (IQ1) | 18.3% | 22.8% |
| Interquartile 75% (IQ3) | 23.8% | 34.9% |
| Interquartile Range (IQR) | 5.5% | 12.1% |
| Standard Deviation (Sample) | 6.6% | 15.6% |
| Standard Deviation (Population) | 6.6% | 15.4% |
Demographics Similar to Immigrants from Latin America and Comanche by 3 or more Vehicles in Household
In terms of 3 or more vehicles in household, the demographic groups most similar to Immigrants from Latin America are Costa Rican (20.6%, a difference of 0.040%), Croatian (20.6%, a difference of 0.15%), Italian (20.6%, a difference of 0.17%), French Canadian (20.6%, a difference of 0.20%), and Burmese (20.6%, a difference of 0.51%). Similarly, the demographic groups most similar to Comanche are Alaska Native (21.0%, a difference of 0.040%), Blackfeet (20.9%, a difference of 0.31%), Seminole (20.9%, a difference of 0.34%), Dutch West Indian (20.9%, a difference of 0.38%), and Luxembourger (20.9%, a difference of 0.46%).
| Demographics | Rating | Rank | 3 or more Vehicles in Household |
| Alaska Natives | 98.2 /100 | #99 | Exceptional 21.0% |
| Comanche | 98.2 /100 | #100 | Exceptional 21.0% |
| Blackfeet | 97.9 /100 | #101 | Exceptional 20.9% |
| Seminole | 97.8 /100 | #102 | Exceptional 20.9% |
| Dutch West Indians | 97.8 /100 | #103 | Exceptional 20.9% |
| Luxembourgers | 97.7 /100 | #104 | Exceptional 20.9% |
| Austrians | 97.5 /100 | #105 | Exceptional 20.9% |
| Bolivians | 97.4 /100 | #106 | Exceptional 20.8% |
| Immigrants | Germany | 97.4 /100 | #107 | Exceptional 20.8% |
| Immigrants | Scotland | 97.1 /100 | #108 | Exceptional 20.8% |
| Filipinos | 97.0 /100 | #109 | Exceptional 20.8% |
| Asians | 96.8 /100 | #110 | Exceptional 20.8% |
| Immigrants | Micronesia | 96.7 /100 | #111 | Exceptional 20.7% |
| Nicaraguans | 96.2 /100 | #112 | Exceptional 20.7% |
| Immigrants | England | 96.2 /100 | #113 | Exceptional 20.7% |
| Burmese | 95.8 /100 | #114 | Exceptional 20.6% |
| French Canadians | 95.0 /100 | #115 | Exceptional 20.6% |
| Italians | 94.9 /100 | #116 | Exceptional 20.6% |
| Croatians | 94.9 /100 | #117 | Exceptional 20.6% |
| Costa Ricans | 94.6 /100 | #118 | Exceptional 20.6% |
| Immigrants | Latin America | 94.5 /100 | #119 | Exceptional 20.5% |