Immigrants from Liberia vs Comanche 1 or more Vehicles in Household
COMPARE
Immigrants from Liberia
Comanche
1 or more Vehicles in Household
1 or more Vehicles in Household Comparison
Immigrants from Liberia
Comanche
87.8%
1 OR MORE VEHICLES IN HOUSEHOLD
0.4/ 100
METRIC RATING
264th/ 347
METRIC RANK
89.9%
1 OR MORE VEHICLES IN HOUSEHOLD
63.4/ 100
METRIC RATING
164th/ 347
METRIC RANK
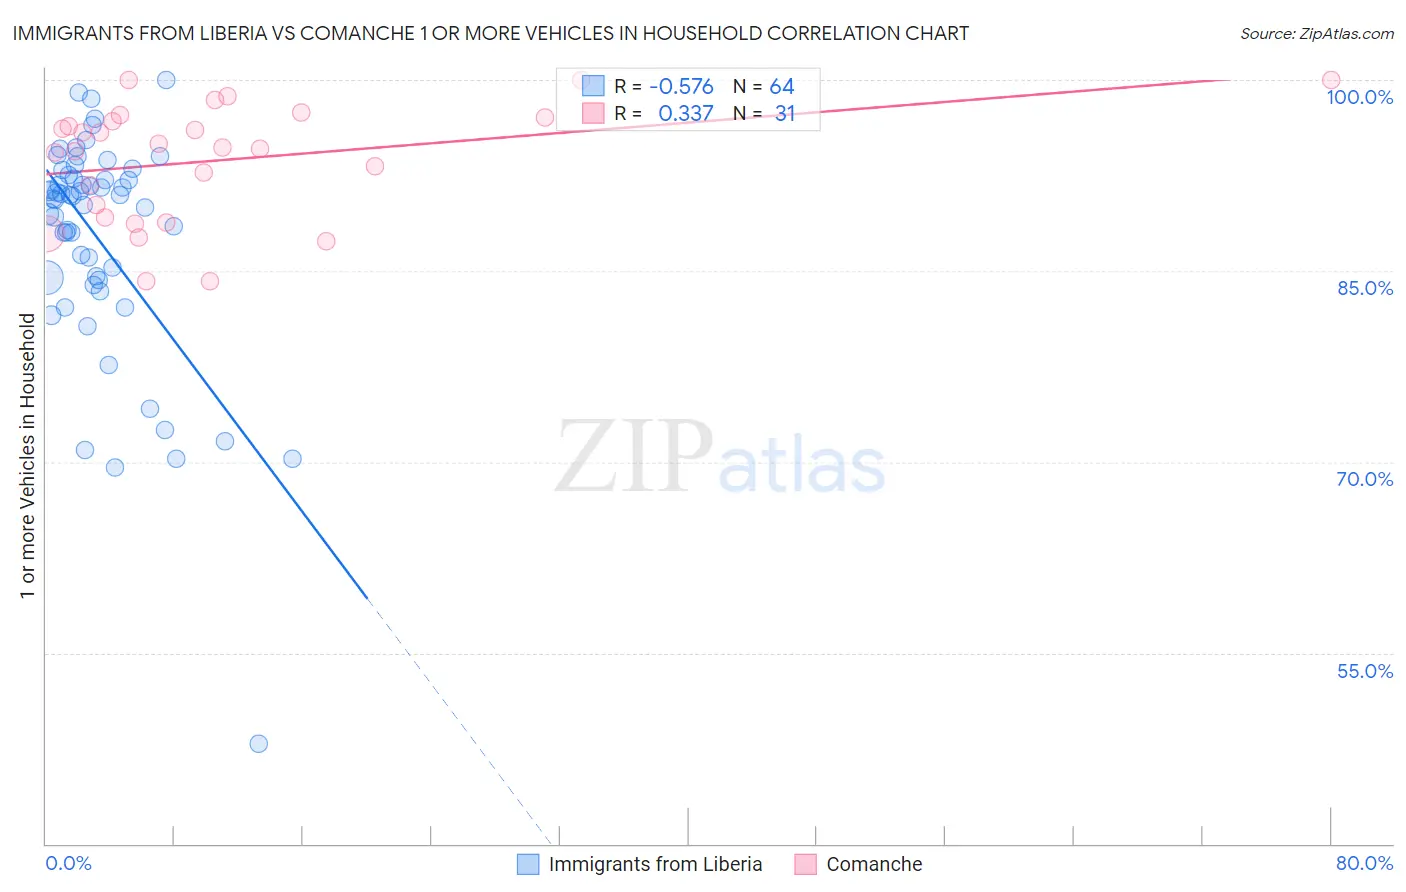
Immigrants from Liberia vs Comanche 1 or more Vehicles in Household Correlation Chart
The statistical analysis conducted on geographies consisting of 135,251,590 people shows a substantial negative correlation between the proportion of Immigrants from Liberia and percentage of households with 1 or more vehicles available in the United States with a correlation coefficient (R) of -0.576 and weighted average of 87.8%. Similarly, the statistical analysis conducted on geographies consisting of 109,768,112 people shows a mild positive correlation between the proportion of Comanche and percentage of households with 1 or more vehicles available in the United States with a correlation coefficient (R) of 0.337 and weighted average of 89.9%, a difference of 2.4%.
1 or more Vehicles in Household Correlation Summary
| Measurement | Immigrants from Liberia | Comanche |
| Minimum | 47.9% | 84.2% |
| Maximum | 100.0% | 100.0% |
| Range | 52.1% | 15.8% |
| Mean | 87.5% | 93.7% |
| Median | 90.7% | 94.7% |
| Interquartile 25% (IQ1) | 84.4% | 89.2% |
| Interquartile 75% (IQ3) | 92.3% | 97.1% |
| Interquartile Range (IQR) | 8.0% | 7.9% |
| Standard Deviation (Sample) | 9.0% | 4.6% |
| Standard Deviation (Population) | 8.9% | 4.5% |
Similar Demographics by 1 or more Vehicles in Household
Demographics Similar to Immigrants from Liberia by 1 or more Vehicles in Household
In terms of 1 or more vehicles in household, the demographic groups most similar to Immigrants from Liberia are Immigrants from Egypt (87.8%, a difference of 0.010%), African (87.8%, a difference of 0.020%), Subsaharan African (87.9%, a difference of 0.080%), Immigrants from Switzerland (87.9%, a difference of 0.11%), and Macedonian (87.9%, a difference of 0.15%).
| Demographics | Rating | Rank | 1 or more Vehicles in Household |
| Liberians | 0.9 /100 | #257 | Tragic 88.0% |
| South American Indians | 0.9 /100 | #258 | Tragic 88.0% |
| Nigerians | 0.8 /100 | #259 | Tragic 88.0% |
| Macedonians | 0.6 /100 | #260 | Tragic 87.9% |
| Immigrants | Switzerland | 0.6 /100 | #261 | Tragic 87.9% |
| Sub-Saharan Africans | 0.5 /100 | #262 | Tragic 87.9% |
| Immigrants | Egypt | 0.5 /100 | #263 | Tragic 87.8% |
| Immigrants | Liberia | 0.4 /100 | #264 | Tragic 87.8% |
| Africans | 0.4 /100 | #265 | Tragic 87.8% |
| Israelis | 0.3 /100 | #266 | Tragic 87.7% |
| Immigrants | Colombia | 0.3 /100 | #267 | Tragic 87.6% |
| Immigrants | Europe | 0.2 /100 | #268 | Tragic 87.6% |
| Immigrants | Africa | 0.2 /100 | #269 | Tragic 87.6% |
| Panamanians | 0.2 /100 | #270 | Tragic 87.5% |
| Bermudans | 0.2 /100 | #271 | Tragic 87.5% |
Demographics Similar to Comanche by 1 or more Vehicles in Household
In terms of 1 or more vehicles in household, the demographic groups most similar to Comanche are Immigrants from Saudi Arabia (89.9%, a difference of 0.010%), Immigrants from Middle Africa (89.9%, a difference of 0.020%), Immigrants from Austria (89.9%, a difference of 0.040%), Immigrants from Latin America (89.8%, a difference of 0.050%), and Immigrants from Cambodia (89.8%, a difference of 0.050%).
| Demographics | Rating | Rank | 1 or more Vehicles in Household |
| Immigrants | Congo | 71.2 /100 | #157 | Good 90.0% |
| Brazilians | 71.0 /100 | #158 | Good 90.0% |
| South Africans | 69.7 /100 | #159 | Good 90.0% |
| Immigrants | Indonesia | 68.8 /100 | #160 | Good 90.0% |
| Salvadorans | 68.7 /100 | #161 | Good 90.0% |
| Spanish American Indians | 67.0 /100 | #162 | Good 89.9% |
| Immigrants | Austria | 65.5 /100 | #163 | Good 89.9% |
| Comanche | 63.4 /100 | #164 | Good 89.9% |
| Immigrants | Saudi Arabia | 62.6 /100 | #165 | Good 89.9% |
| Immigrants | Middle Africa | 62.2 /100 | #166 | Good 89.9% |
| Immigrants | Latin America | 60.3 /100 | #167 | Good 89.8% |
| Immigrants | Cambodia | 60.1 /100 | #168 | Good 89.8% |
| Natives/Alaskans | 59.5 /100 | #169 | Average 89.8% |
| Immigrants | Costa Rica | 57.6 /100 | #170 | Average 89.8% |
| French American Indians | 54.4 /100 | #171 | Average 89.8% |