Immigrants from Liberia vs Guatemalan 3 or more Vehicles in Household
COMPARE
Immigrants from Liberia
Guatemalan
3 or more Vehicles in Household
3 or more Vehicles in Household Comparison
Immigrants from Liberia
Guatemalans
17.1%
3 OR MORE VEHICLES IN HOUSEHOLD
0.1/ 100
METRIC RATING
289th/ 347
METRIC RANK
20.1%
3 OR MORE VEHICLES IN HOUSEHOLD
82.6/ 100
METRIC RATING
148th/ 347
METRIC RANK
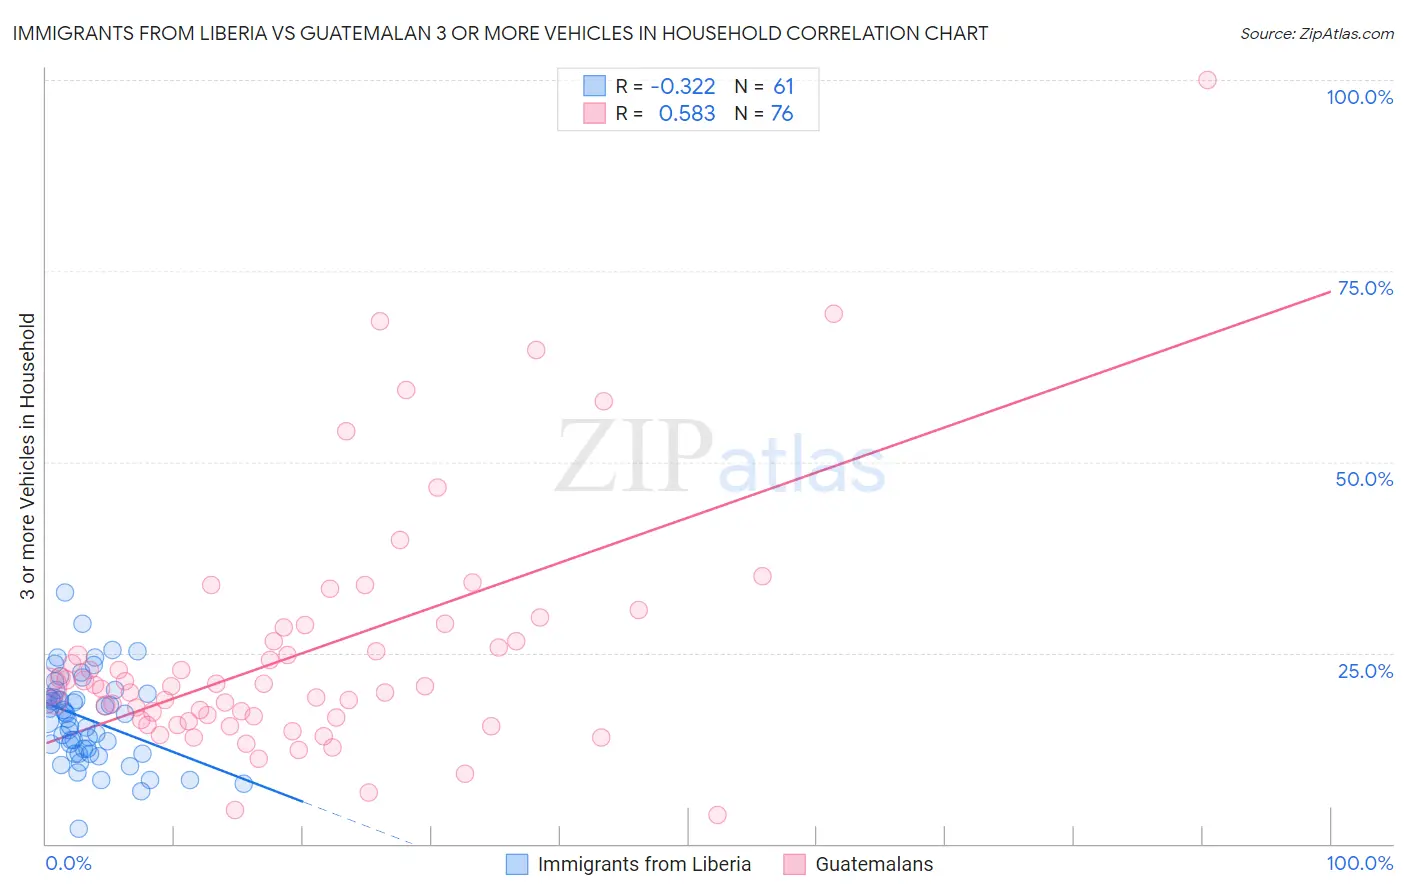
Immigrants from Liberia vs Guatemalan 3 or more Vehicles in Household Correlation Chart
The statistical analysis conducted on geographies consisting of 135,209,335 people shows a mild negative correlation between the proportion of Immigrants from Liberia and percentage of households with 3 or more vehicles available in the United States with a correlation coefficient (R) of -0.322 and weighted average of 17.1%. Similarly, the statistical analysis conducted on geographies consisting of 409,244,641 people shows a substantial positive correlation between the proportion of Guatemalans and percentage of households with 3 or more vehicles available in the United States with a correlation coefficient (R) of 0.583 and weighted average of 20.1%, a difference of 17.4%.
3 or more Vehicles in Household Correlation Summary
| Measurement | Immigrants from Liberia | Guatemalan |
| Minimum | 2.0% | 3.8% |
| Maximum | 32.8% | 100.0% |
| Range | 30.9% | 96.2% |
| Mean | 16.4% | 25.1% |
| Median | 17.0% | 20.6% |
| Interquartile 25% (IQ1) | 12.1% | 16.3% |
| Interquartile 75% (IQ3) | 19.4% | 27.4% |
| Interquartile Range (IQR) | 7.3% | 11.1% |
| Standard Deviation (Sample) | 5.7% | 16.1% |
| Standard Deviation (Population) | 5.7% | 16.0% |
Similar Demographics by 3 or more Vehicles in Household
Demographics Similar to Immigrants from Liberia by 3 or more Vehicles in Household
In terms of 3 or more vehicles in household, the demographic groups most similar to Immigrants from Liberia are Immigrants from Uruguay (17.1%, a difference of 0.070%), Immigrants from Brazil (17.1%, a difference of 0.16%), Menominee (17.2%, a difference of 0.46%), Immigrants from Croatia (17.2%, a difference of 0.52%), and Liberian (17.0%, a difference of 0.57%).
| Demographics | Rating | Rank | 3 or more Vehicles in Household |
| Immigrants | Ireland | 0.3 /100 | #282 | Tragic 17.3% |
| Blacks/African Americans | 0.3 /100 | #283 | Tragic 17.3% |
| Immigrants | Colombia | 0.3 /100 | #284 | Tragic 17.3% |
| Immigrants | Croatia | 0.2 /100 | #285 | Tragic 17.2% |
| Menominee | 0.2 /100 | #286 | Tragic 17.2% |
| Immigrants | Brazil | 0.2 /100 | #287 | Tragic 17.1% |
| Immigrants | Uruguay | 0.2 /100 | #288 | Tragic 17.1% |
| Immigrants | Liberia | 0.1 /100 | #289 | Tragic 17.1% |
| Liberians | 0.1 /100 | #290 | Tragic 17.0% |
| Immigrants | Congo | 0.1 /100 | #291 | Tragic 17.0% |
| Immigrants | Spain | 0.1 /100 | #292 | Tragic 17.0% |
| Bahamians | 0.1 /100 | #293 | Tragic 16.9% |
| Immigrants | Western Africa | 0.1 /100 | #294 | Tragic 16.9% |
| Immigrants | Russia | 0.1 /100 | #295 | Tragic 16.9% |
| Inupiat | 0.1 /100 | #296 | Tragic 16.9% |
Demographics Similar to Guatemalans by 3 or more Vehicles in Household
In terms of 3 or more vehicles in household, the demographic groups most similar to Guatemalans are Slovak (20.1%, a difference of 0.060%), Australian (20.1%, a difference of 0.14%), Palestinian (20.1%, a difference of 0.18%), Iranian (20.1%, a difference of 0.19%), and Immigrants from Iran (20.0%, a difference of 0.20%).
| Demographics | Rating | Rank | 3 or more Vehicles in Household |
| Ottawa | 84.9 /100 | #141 | Excellent 20.1% |
| Jordanians | 84.4 /100 | #142 | Excellent 20.1% |
| Lithuanians | 84.4 /100 | #143 | Excellent 20.1% |
| Iranians | 84.0 /100 | #144 | Excellent 20.1% |
| Palestinians | 83.9 /100 | #145 | Excellent 20.1% |
| Australians | 83.6 /100 | #146 | Excellent 20.1% |
| Slovaks | 83.0 /100 | #147 | Excellent 20.1% |
| Guatemalans | 82.6 /100 | #148 | Excellent 20.1% |
| Immigrants | Iran | 80.9 /100 | #149 | Excellent 20.0% |
| Immigrants | Immigrants | 80.8 /100 | #150 | Excellent 20.0% |
| Taiwanese | 80.6 /100 | #151 | Excellent 20.0% |
| Lebanese | 79.8 /100 | #152 | Good 20.0% |
| Yuman | 75.6 /100 | #153 | Good 19.9% |
| Immigrants | Jordan | 75.0 /100 | #154 | Good 19.9% |
| Tlingit-Haida | 73.4 /100 | #155 | Good 19.9% |