Immigrants from Taiwan vs Comanche 3 or more Vehicles in Household
COMPARE
Immigrants from Taiwan
Comanche
3 or more Vehicles in Household
3 or more Vehicles in Household Comparison
Immigrants from Taiwan
Comanche
22.1%
3 OR MORE VEHICLES IN HOUSEHOLD
99.9/ 100
METRIC RATING
64th/ 347
METRIC RANK
21.0%
3 OR MORE VEHICLES IN HOUSEHOLD
98.2/ 100
METRIC RATING
100th/ 347
METRIC RANK
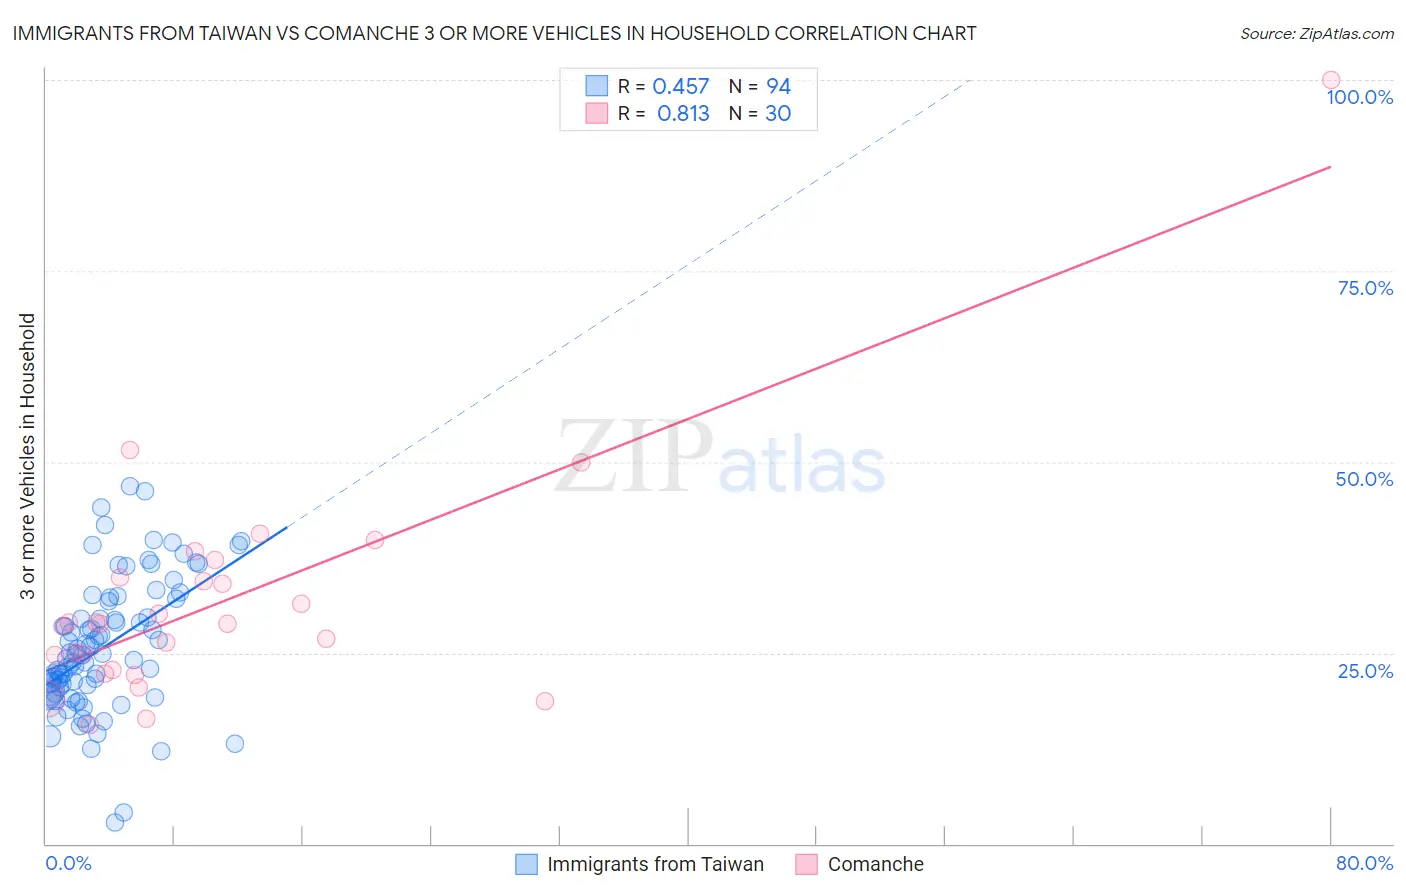
Immigrants from Taiwan vs Comanche 3 or more Vehicles in Household Correlation Chart
The statistical analysis conducted on geographies consisting of 298,037,283 people shows a moderate positive correlation between the proportion of Immigrants from Taiwan and percentage of households with 3 or more vehicles available in the United States with a correlation coefficient (R) of 0.457 and weighted average of 22.1%. Similarly, the statistical analysis conducted on geographies consisting of 109,768,043 people shows a very strong positive correlation between the proportion of Comanche and percentage of households with 3 or more vehicles available in the United States with a correlation coefficient (R) of 0.813 and weighted average of 21.0%, a difference of 5.5%.
3 or more Vehicles in Household Correlation Summary
| Measurement | Immigrants from Taiwan | Comanche |
| Minimum | 2.7% | 15.6% |
| Maximum | 46.8% | 100.0% |
| Range | 44.0% | 84.4% |
| Mean | 25.8% | 31.7% |
| Median | 24.8% | 28.8% |
| Interquartile 25% (IQ1) | 20.1% | 22.8% |
| Interquartile 75% (IQ3) | 31.7% | 34.9% |
| Interquartile Range (IQR) | 11.6% | 12.1% |
| Standard Deviation (Sample) | 8.6% | 15.6% |
| Standard Deviation (Population) | 8.6% | 15.4% |
Similar Demographics by 3 or more Vehicles in Household
Demographics Similar to Immigrants from Taiwan by 3 or more Vehicles in Household
In terms of 3 or more vehicles in household, the demographic groups most similar to Immigrants from Taiwan are Chickasaw (22.2%, a difference of 0.33%), Pima (22.0%, a difference of 0.42%), Fijian (22.2%, a difference of 0.49%), Bhutanese (22.2%, a difference of 0.54%), and Northern European (22.0%, a difference of 0.56%).
| Demographics | Rating | Rank | 3 or more Vehicles in Household |
| Pennsylvania Germans | 100.0 /100 | #57 | Exceptional 22.3% |
| Spaniards | 100.0 /100 | #58 | Exceptional 22.3% |
| Navajo | 100.0 /100 | #59 | Exceptional 22.3% |
| Finns | 99.9 /100 | #60 | Exceptional 22.3% |
| Bhutanese | 99.9 /100 | #61 | Exceptional 22.2% |
| Fijians | 99.9 /100 | #62 | Exceptional 22.2% |
| Chickasaw | 99.9 /100 | #63 | Exceptional 22.2% |
| Immigrants | Taiwan | 99.9 /100 | #64 | Exceptional 22.1% |
| Pima | 99.9 /100 | #65 | Exceptional 22.0% |
| Northern Europeans | 99.9 /100 | #66 | Exceptional 22.0% |
| Alaskan Athabascans | 99.9 /100 | #67 | Exceptional 21.9% |
| British | 99.9 /100 | #68 | Exceptional 21.9% |
| Creek | 99.9 /100 | #69 | Exceptional 21.9% |
| Bangladeshis | 99.8 /100 | #70 | Exceptional 21.9% |
| Potawatomi | 99.8 /100 | #71 | Exceptional 21.9% |
Demographics Similar to Comanche by 3 or more Vehicles in Household
In terms of 3 or more vehicles in household, the demographic groups most similar to Comanche are Hmong (21.0%, a difference of 0.040%), Alaska Native (21.0%, a difference of 0.040%), Canadian (21.0%, a difference of 0.10%), Cree (21.0%, a difference of 0.21%), and Pakistani (21.0%, a difference of 0.30%).
| Demographics | Rating | Rank | 3 or more Vehicles in Household |
| Immigrants | Indonesia | 98.8 /100 | #93 | Exceptional 21.1% |
| Immigrants | Cambodia | 98.6 /100 | #94 | Exceptional 21.1% |
| Pakistanis | 98.5 /100 | #95 | Exceptional 21.0% |
| Cree | 98.4 /100 | #96 | Exceptional 21.0% |
| Canadians | 98.3 /100 | #97 | Exceptional 21.0% |
| Hmong | 98.2 /100 | #98 | Exceptional 21.0% |
| Alaska Natives | 98.2 /100 | #99 | Exceptional 21.0% |
| Comanche | 98.2 /100 | #100 | Exceptional 21.0% |
| Blackfeet | 97.9 /100 | #101 | Exceptional 20.9% |
| Seminole | 97.8 /100 | #102 | Exceptional 20.9% |
| Dutch West Indians | 97.8 /100 | #103 | Exceptional 20.9% |
| Luxembourgers | 97.7 /100 | #104 | Exceptional 20.9% |
| Austrians | 97.5 /100 | #105 | Exceptional 20.9% |
| Bolivians | 97.4 /100 | #106 | Exceptional 20.8% |
| Immigrants | Germany | 97.4 /100 | #107 | Exceptional 20.8% |