African vs Comanche 3 or more Vehicles in Household
COMPARE
African
Comanche
3 or more Vehicles in Household
3 or more Vehicles in Household Comparison
Africans
Comanche
18.2%
3 OR MORE VEHICLES IN HOUSEHOLD
2.7/ 100
METRIC RATING
241st/ 347
METRIC RANK
21.0%
3 OR MORE VEHICLES IN HOUSEHOLD
98.2/ 100
METRIC RATING
100th/ 347
METRIC RANK
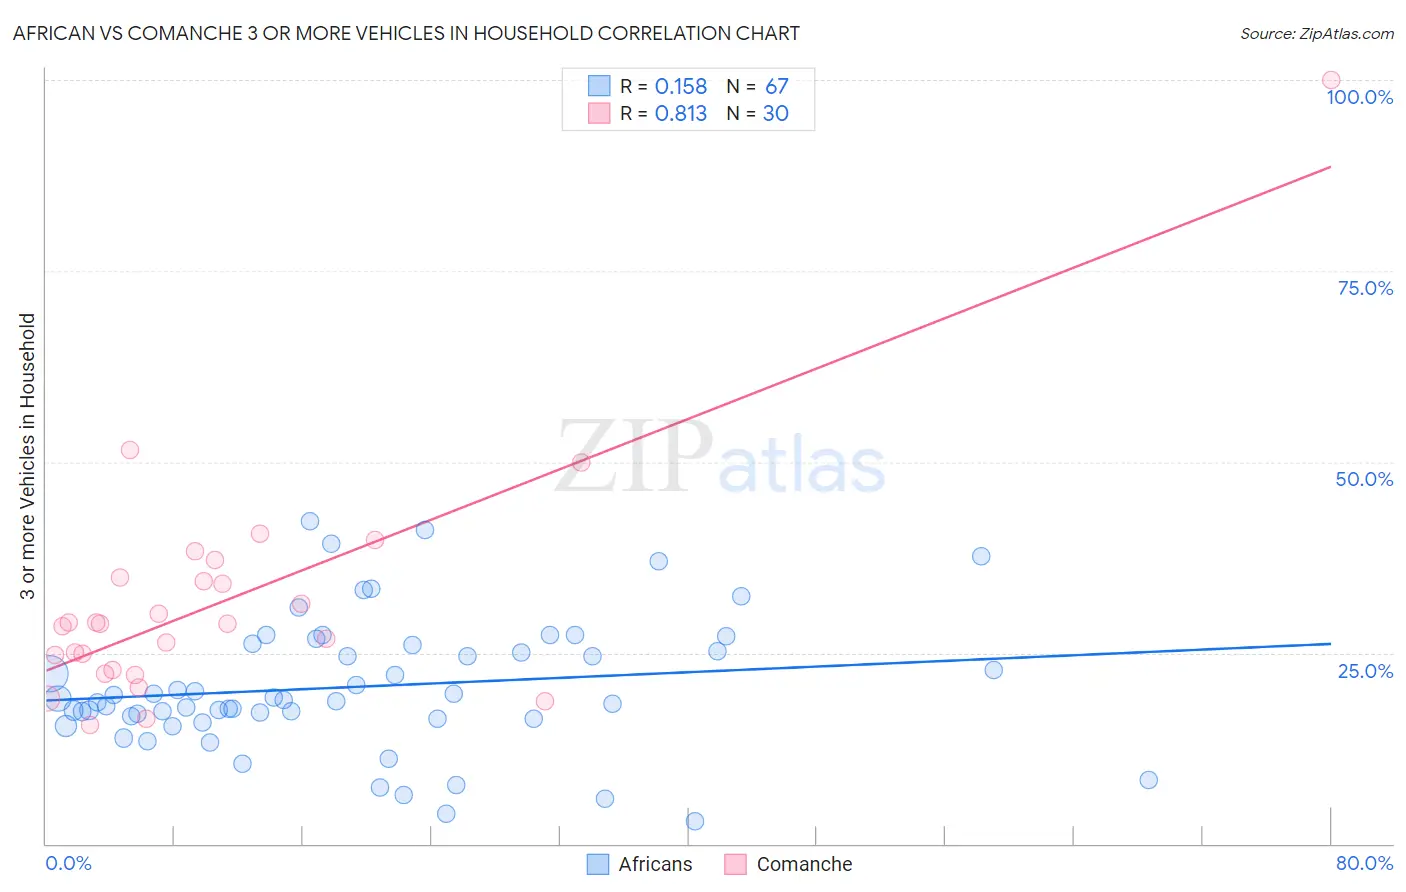
African vs Comanche 3 or more Vehicles in Household Correlation Chart
The statistical analysis conducted on geographies consisting of 469,466,855 people shows a poor positive correlation between the proportion of Africans and percentage of households with 3 or more vehicles available in the United States with a correlation coefficient (R) of 0.158 and weighted average of 18.2%. Similarly, the statistical analysis conducted on geographies consisting of 109,768,043 people shows a very strong positive correlation between the proportion of Comanche and percentage of households with 3 or more vehicles available in the United States with a correlation coefficient (R) of 0.813 and weighted average of 21.0%, a difference of 15.4%.
3 or more Vehicles in Household Correlation Summary
| Measurement | African | Comanche |
| Minimum | 3.0% | 15.6% |
| Maximum | 42.3% | 100.0% |
| Range | 39.3% | 84.4% |
| Mean | 20.6% | 31.7% |
| Median | 18.9% | 28.8% |
| Interquartile 25% (IQ1) | 16.3% | 22.8% |
| Interquartile 75% (IQ3) | 26.1% | 34.9% |
| Interquartile Range (IQR) | 9.8% | 12.1% |
| Standard Deviation (Sample) | 8.6% | 15.6% |
| Standard Deviation (Population) | 8.6% | 15.4% |
Similar Demographics by 3 or more Vehicles in Household
Demographics Similar to Africans by 3 or more Vehicles in Household
In terms of 3 or more vehicles in household, the demographic groups most similar to Africans are Hopi (18.2%, a difference of 0.11%), Immigrants from China (18.2%, a difference of 0.20%), Immigrants from Europe (18.1%, a difference of 0.23%), Immigrants from Middle Africa (18.2%, a difference of 0.32%), and Immigrants from Honduras (18.2%, a difference of 0.33%).
| Demographics | Rating | Rank | 3 or more Vehicles in Household |
| Immigrants | North Macedonia | 4.4 /100 | #234 | Tragic 18.4% |
| Sierra Leoneans | 3.9 /100 | #235 | Tragic 18.3% |
| Immigrants | Malaysia | 3.6 /100 | #236 | Tragic 18.3% |
| Indonesians | 3.5 /100 | #237 | Tragic 18.3% |
| Immigrants | Honduras | 3.1 /100 | #238 | Tragic 18.2% |
| Immigrants | Middle Africa | 3.1 /100 | #239 | Tragic 18.2% |
| Immigrants | China | 2.9 /100 | #240 | Tragic 18.2% |
| Africans | 2.7 /100 | #241 | Tragic 18.2% |
| Hopi | 2.5 /100 | #242 | Tragic 18.2% |
| Immigrants | Europe | 2.4 /100 | #243 | Tragic 18.1% |
| Mongolians | 2.3 /100 | #244 | Tragic 18.1% |
| Immigrants | Belize | 2.1 /100 | #245 | Tragic 18.1% |
| Immigrants | Australia | 2.0 /100 | #246 | Tragic 18.1% |
| Carpatho Rusyns | 1.9 /100 | #247 | Tragic 18.0% |
| Immigrants | Eastern Africa | 1.8 /100 | #248 | Tragic 18.0% |
Demographics Similar to Comanche by 3 or more Vehicles in Household
In terms of 3 or more vehicles in household, the demographic groups most similar to Comanche are Hmong (21.0%, a difference of 0.040%), Alaska Native (21.0%, a difference of 0.040%), Canadian (21.0%, a difference of 0.10%), Cree (21.0%, a difference of 0.21%), and Pakistani (21.0%, a difference of 0.30%).
| Demographics | Rating | Rank | 3 or more Vehicles in Household |
| Immigrants | Indonesia | 98.8 /100 | #93 | Exceptional 21.1% |
| Immigrants | Cambodia | 98.6 /100 | #94 | Exceptional 21.1% |
| Pakistanis | 98.5 /100 | #95 | Exceptional 21.0% |
| Cree | 98.4 /100 | #96 | Exceptional 21.0% |
| Canadians | 98.3 /100 | #97 | Exceptional 21.0% |
| Hmong | 98.2 /100 | #98 | Exceptional 21.0% |
| Alaska Natives | 98.2 /100 | #99 | Exceptional 21.0% |
| Comanche | 98.2 /100 | #100 | Exceptional 21.0% |
| Blackfeet | 97.9 /100 | #101 | Exceptional 20.9% |
| Seminole | 97.8 /100 | #102 | Exceptional 20.9% |
| Dutch West Indians | 97.8 /100 | #103 | Exceptional 20.9% |
| Luxembourgers | 97.7 /100 | #104 | Exceptional 20.9% |
| Austrians | 97.5 /100 | #105 | Exceptional 20.9% |
| Bolivians | 97.4 /100 | #106 | Exceptional 20.8% |
| Immigrants | Germany | 97.4 /100 | #107 | Exceptional 20.8% |