South American vs Comanche 3 or more Vehicles in Household
COMPARE
South American
Comanche
3 or more Vehicles in Household
3 or more Vehicles in Household Comparison
South Americans
Comanche
17.6%
3 OR MORE VEHICLES IN HOUSEHOLD
0.6/ 100
METRIC RATING
271st/ 347
METRIC RANK
21.0%
3 OR MORE VEHICLES IN HOUSEHOLD
98.2/ 100
METRIC RATING
100th/ 347
METRIC RANK
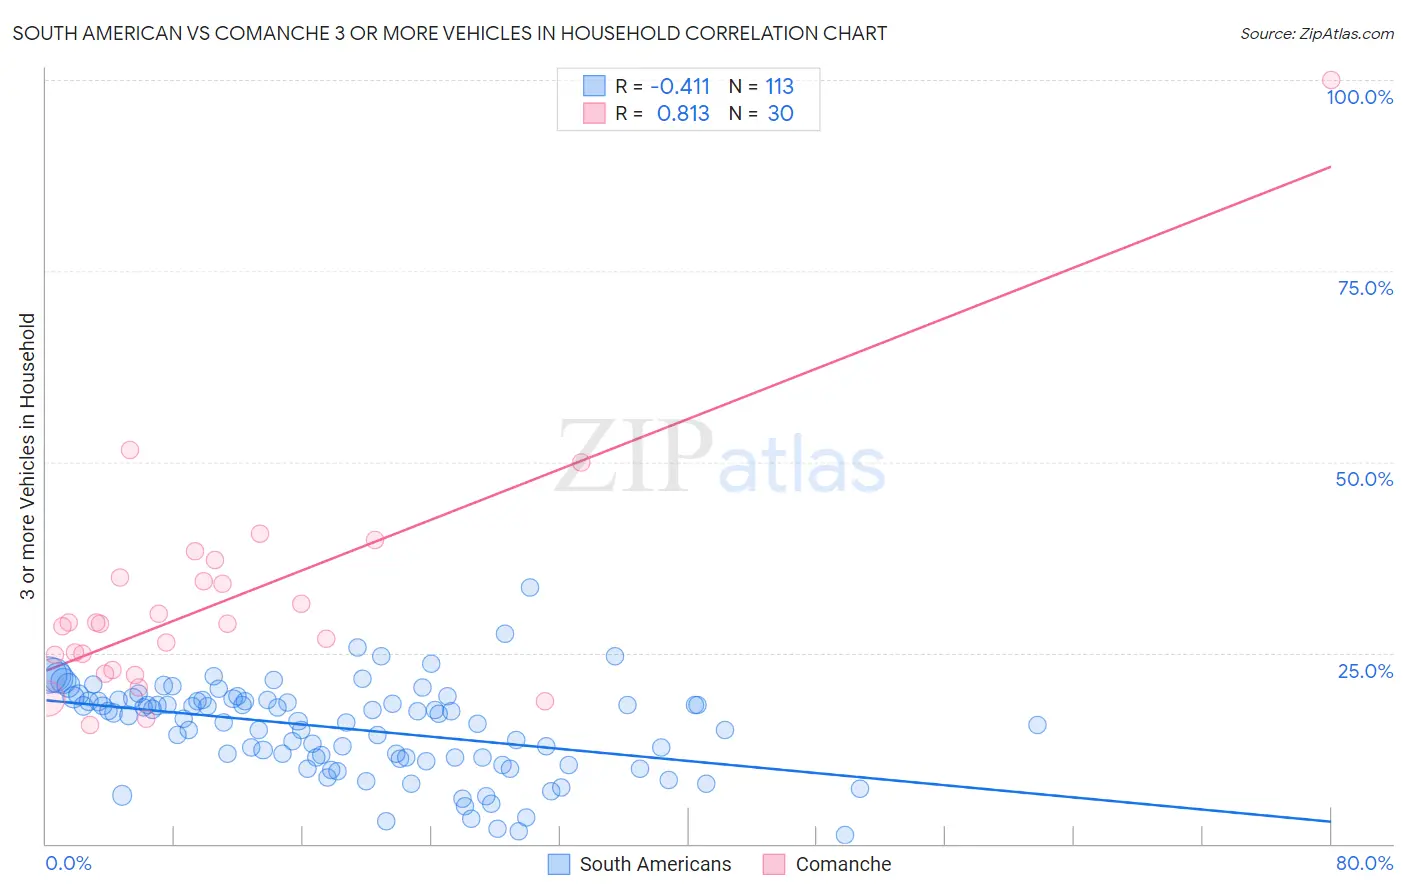
South American vs Comanche 3 or more Vehicles in Household Correlation Chart
The statistical analysis conducted on geographies consisting of 493,452,130 people shows a moderate negative correlation between the proportion of South Americans and percentage of households with 3 or more vehicles available in the United States with a correlation coefficient (R) of -0.411 and weighted average of 17.6%. Similarly, the statistical analysis conducted on geographies consisting of 109,768,043 people shows a very strong positive correlation between the proportion of Comanche and percentage of households with 3 or more vehicles available in the United States with a correlation coefficient (R) of 0.813 and weighted average of 21.0%, a difference of 19.0%.
3 or more Vehicles in Household Correlation Summary
| Measurement | South American | Comanche |
| Minimum | 1.1% | 15.6% |
| Maximum | 33.5% | 100.0% |
| Range | 32.4% | 84.4% |
| Mean | 15.1% | 31.7% |
| Median | 16.8% | 28.8% |
| Interquartile 25% (IQ1) | 11.2% | 22.8% |
| Interquartile 75% (IQ3) | 18.8% | 34.9% |
| Interquartile Range (IQR) | 7.7% | 12.1% |
| Standard Deviation (Sample) | 6.0% | 15.6% |
| Standard Deviation (Population) | 5.9% | 15.4% |
Similar Demographics by 3 or more Vehicles in Household
Demographics Similar to South Americans by 3 or more Vehicles in Household
In terms of 3 or more vehicles in household, the demographic groups most similar to South Americans are Immigrants from Nepal (17.6%, a difference of 0.0%), Immigrants from France (17.6%, a difference of 0.050%), Immigrants from Africa (17.6%, a difference of 0.41%), Immigrants from Sudan (17.6%, a difference of 0.45%), and Immigrants from Bulgaria (17.7%, a difference of 0.48%).
| Demographics | Rating | Rank | 3 or more Vehicles in Household |
| Cambodians | 0.9 /100 | #264 | Tragic 17.8% |
| Immigrants | Panama | 0.8 /100 | #265 | Tragic 17.7% |
| Macedonians | 0.8 /100 | #266 | Tragic 17.7% |
| Immigrants | Venezuela | 0.8 /100 | #267 | Tragic 17.7% |
| Immigrants | Bulgaria | 0.8 /100 | #268 | Tragic 17.7% |
| Immigrants | France | 0.6 /100 | #269 | Tragic 17.6% |
| Immigrants | Nepal | 0.6 /100 | #270 | Tragic 17.6% |
| South Americans | 0.6 /100 | #271 | Tragic 17.6% |
| Immigrants | Africa | 0.5 /100 | #272 | Tragic 17.6% |
| Immigrants | Sudan | 0.5 /100 | #273 | Tragic 17.6% |
| Immigrants | Bosnia and Herzegovina | 0.5 /100 | #274 | Tragic 17.5% |
| Immigrants | Ukraine | 0.4 /100 | #275 | Tragic 17.5% |
| Okinawans | 0.4 /100 | #276 | Tragic 17.4% |
| Brazilians | 0.4 /100 | #277 | Tragic 17.4% |
| Immigrants | Bahamas | 0.3 /100 | #278 | Tragic 17.4% |
Demographics Similar to Comanche by 3 or more Vehicles in Household
In terms of 3 or more vehicles in household, the demographic groups most similar to Comanche are Hmong (21.0%, a difference of 0.040%), Alaska Native (21.0%, a difference of 0.040%), Canadian (21.0%, a difference of 0.10%), Cree (21.0%, a difference of 0.21%), and Pakistani (21.0%, a difference of 0.30%).
| Demographics | Rating | Rank | 3 or more Vehicles in Household |
| Immigrants | Indonesia | 98.8 /100 | #93 | Exceptional 21.1% |
| Immigrants | Cambodia | 98.6 /100 | #94 | Exceptional 21.1% |
| Pakistanis | 98.5 /100 | #95 | Exceptional 21.0% |
| Cree | 98.4 /100 | #96 | Exceptional 21.0% |
| Canadians | 98.3 /100 | #97 | Exceptional 21.0% |
| Hmong | 98.2 /100 | #98 | Exceptional 21.0% |
| Alaska Natives | 98.2 /100 | #99 | Exceptional 21.0% |
| Comanche | 98.2 /100 | #100 | Exceptional 21.0% |
| Blackfeet | 97.9 /100 | #101 | Exceptional 20.9% |
| Seminole | 97.8 /100 | #102 | Exceptional 20.9% |
| Dutch West Indians | 97.8 /100 | #103 | Exceptional 20.9% |
| Luxembourgers | 97.7 /100 | #104 | Exceptional 20.9% |
| Austrians | 97.5 /100 | #105 | Exceptional 20.9% |
| Bolivians | 97.4 /100 | #106 | Exceptional 20.8% |
| Immigrants | Germany | 97.4 /100 | #107 | Exceptional 20.8% |