Immigrants from Afghanistan vs White/Caucasian 3 or more Vehicles in Household
COMPARE
Immigrants from Afghanistan
White/Caucasian
3 or more Vehicles in Household
3 or more Vehicles in Household Comparison
Immigrants from Afghanistan
Whites/Caucasians
21.2%
3 OR MORE VEHICLES IN HOUSEHOLD
99.1/ 100
METRIC RATING
90th/ 347
METRIC RANK
22.6%
3 OR MORE VEHICLES IN HOUSEHOLD
100.0/ 100
METRIC RATING
51st/ 347
METRIC RANK
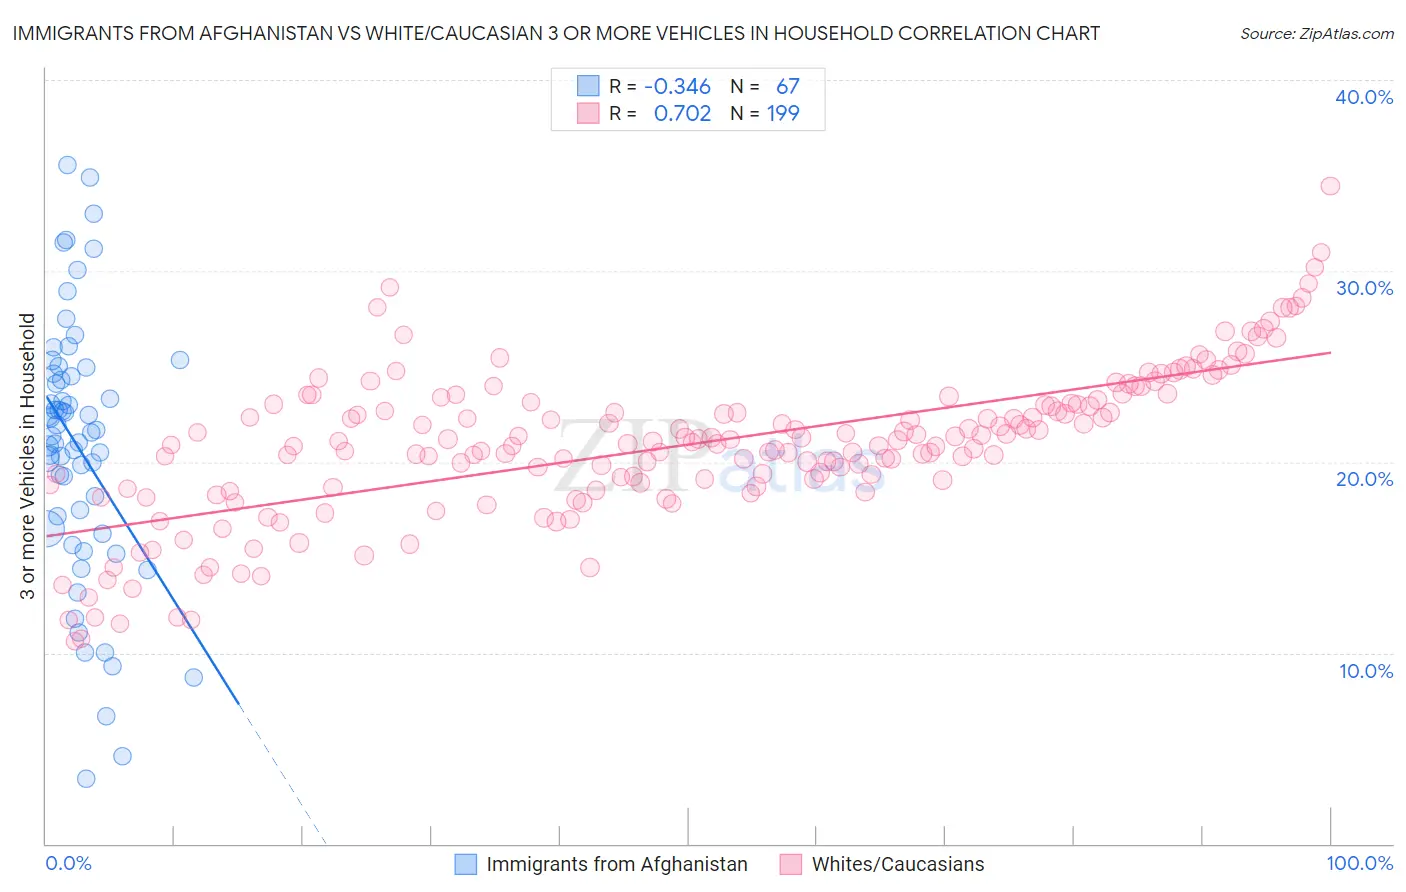
Immigrants from Afghanistan vs White/Caucasian 3 or more Vehicles in Household Correlation Chart
The statistical analysis conducted on geographies consisting of 147,579,076 people shows a mild negative correlation between the proportion of Immigrants from Afghanistan and percentage of households with 3 or more vehicles available in the United States with a correlation coefficient (R) of -0.346 and weighted average of 21.2%. Similarly, the statistical analysis conducted on geographies consisting of 571,274,380 people shows a strong positive correlation between the proportion of Whites/Caucasians and percentage of households with 3 or more vehicles available in the United States with a correlation coefficient (R) of 0.702 and weighted average of 22.6%, a difference of 6.3%.
3 or more Vehicles in Household Correlation Summary
| Measurement | Immigrants from Afghanistan | White/Caucasian |
| Minimum | 3.4% | 10.6% |
| Maximum | 35.6% | 34.4% |
| Range | 32.2% | 23.8% |
| Mean | 20.7% | 20.9% |
| Median | 21.5% | 21.1% |
| Interquartile 25% (IQ1) | 16.5% | 18.8% |
| Interquartile 75% (IQ3) | 24.6% | 23.1% |
| Interquartile Range (IQR) | 8.1% | 4.3% |
| Standard Deviation (Sample) | 6.9% | 4.0% |
| Standard Deviation (Population) | 6.8% | 4.0% |
Similar Demographics by 3 or more Vehicles in Household
Demographics Similar to Immigrants from Afghanistan by 3 or more Vehicles in Household
In terms of 3 or more vehicles in household, the demographic groups most similar to Immigrants from Afghanistan are Marshallese (21.3%, a difference of 0.22%), Belgian (21.2%, a difference of 0.33%), Apache (21.2%, a difference of 0.41%), Immigrants from Indonesia (21.1%, a difference of 0.61%), and French (21.4%, a difference of 0.78%).
| Demographics | Rating | Rank | 3 or more Vehicles in Household |
| Chippewa | 99.6 /100 | #83 | Exceptional 21.5% |
| Icelanders | 99.6 /100 | #84 | Exceptional 21.5% |
| Laotians | 99.6 /100 | #85 | Exceptional 21.5% |
| Delaware | 99.6 /100 | #86 | Exceptional 21.5% |
| Immigrants | Azores | 99.5 /100 | #87 | Exceptional 21.5% |
| French | 99.4 /100 | #88 | Exceptional 21.4% |
| Marshallese | 99.2 /100 | #89 | Exceptional 21.3% |
| Immigrants | Afghanistan | 99.1 /100 | #90 | Exceptional 21.2% |
| Belgians | 98.9 /100 | #91 | Exceptional 21.2% |
| Apache | 98.9 /100 | #92 | Exceptional 21.2% |
| Immigrants | Indonesia | 98.8 /100 | #93 | Exceptional 21.1% |
| Immigrants | Cambodia | 98.6 /100 | #94 | Exceptional 21.1% |
| Pakistanis | 98.5 /100 | #95 | Exceptional 21.0% |
| Cree | 98.4 /100 | #96 | Exceptional 21.0% |
| Canadians | 98.3 /100 | #97 | Exceptional 21.0% |
Demographics Similar to Whites/Caucasians by 3 or more Vehicles in Household
In terms of 3 or more vehicles in household, the demographic groups most similar to Whites/Caucasians are Sioux (22.6%, a difference of 0.010%), Welsh (22.6%, a difference of 0.040%), Scotch-Irish (22.6%, a difference of 0.060%), Scottish (22.6%, a difference of 0.17%), and Malaysian (22.6%, a difference of 0.18%).
| Demographics | Rating | Rank | 3 or more Vehicles in Household |
| Cheyenne | 100.0 /100 | #44 | Exceptional 22.7% |
| Ute | 100.0 /100 | #45 | Exceptional 22.7% |
| Americans | 100.0 /100 | #46 | Exceptional 22.6% |
| Malaysians | 100.0 /100 | #47 | Exceptional 22.6% |
| Scottish | 100.0 /100 | #48 | Exceptional 22.6% |
| Scotch-Irish | 100.0 /100 | #49 | Exceptional 22.6% |
| Sioux | 100.0 /100 | #50 | Exceptional 22.6% |
| Whites/Caucasians | 100.0 /100 | #51 | Exceptional 22.6% |
| Welsh | 100.0 /100 | #52 | Exceptional 22.6% |
| Czechs | 100.0 /100 | #53 | Exceptional 22.5% |
| Crow | 100.0 /100 | #54 | Exceptional 22.5% |
| Immigrants | Laos | 100.0 /100 | #55 | Exceptional 22.4% |
| Hispanics or Latinos | 100.0 /100 | #56 | Exceptional 22.4% |
| Pennsylvania Germans | 100.0 /100 | #57 | Exceptional 22.3% |
| Spaniards | 100.0 /100 | #58 | Exceptional 22.3% |