Immigrants from Greece vs Aleut 1 or more Vehicles in Household
COMPARE
Immigrants from Greece
Aleut
1 or more Vehicles in Household
1 or more Vehicles in Household Comparison
Immigrants from Greece
Aleuts
85.4%
1 OR MORE VEHICLES IN HOUSEHOLD
0.0/ 100
METRIC RATING
303rd/ 347
METRIC RANK
87.5%
1 OR MORE VEHICLES IN HOUSEHOLD
0.2/ 100
METRIC RATING
272nd/ 347
METRIC RANK
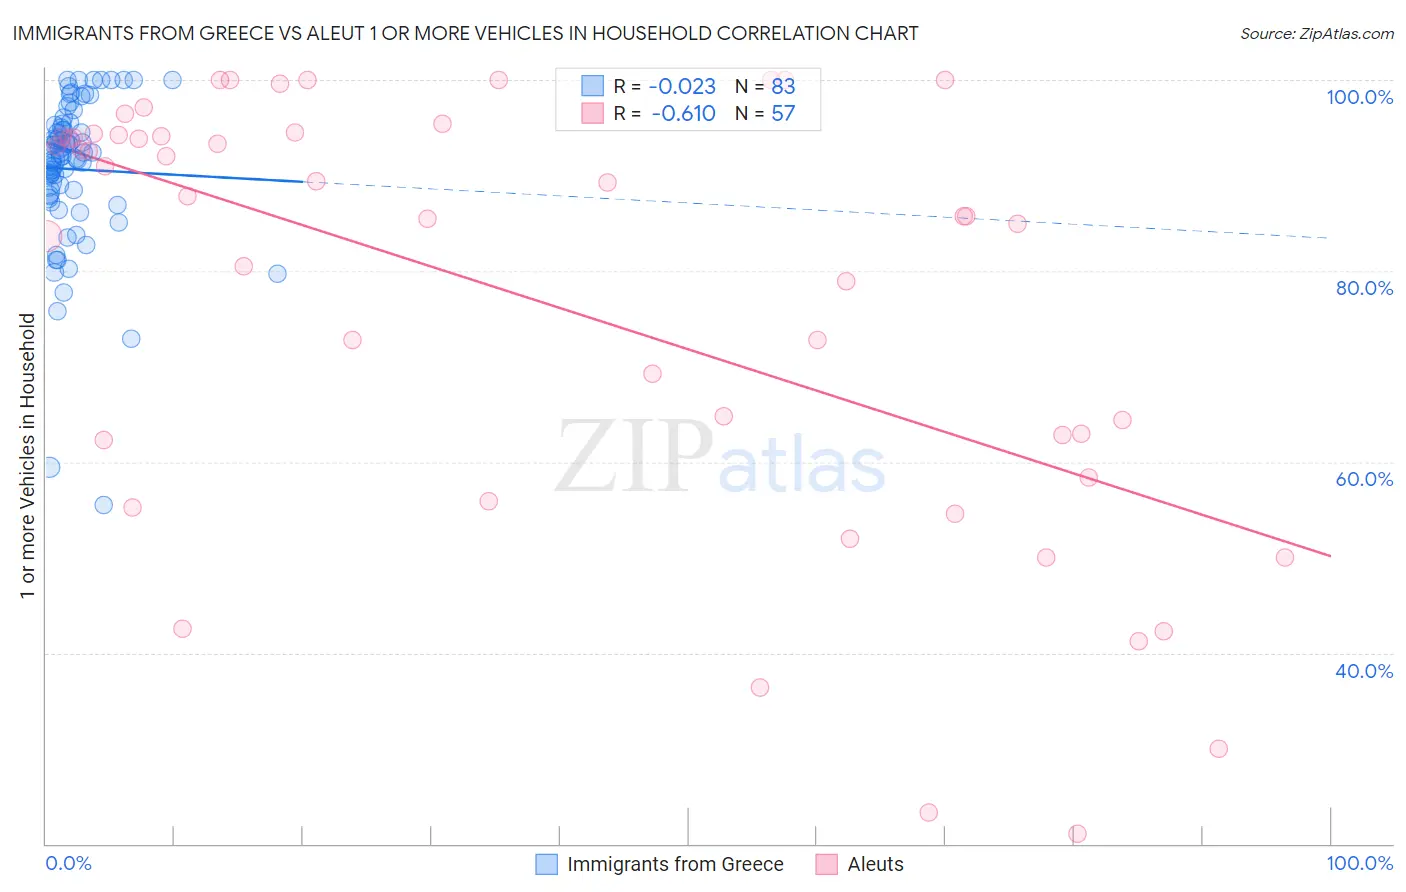
Immigrants from Greece vs Aleut 1 or more Vehicles in Household Correlation Chart
The statistical analysis conducted on geographies consisting of 216,749,502 people shows no correlation between the proportion of Immigrants from Greece and percentage of households with 1 or more vehicles available in the United States with a correlation coefficient (R) of -0.023 and weighted average of 85.4%. Similarly, the statistical analysis conducted on geographies consisting of 61,775,894 people shows a significant negative correlation between the proportion of Aleuts and percentage of households with 1 or more vehicles available in the United States with a correlation coefficient (R) of -0.610 and weighted average of 87.5%, a difference of 2.5%.
1 or more Vehicles in Household Correlation Summary
| Measurement | Immigrants from Greece | Aleut |
| Minimum | 55.5% | 21.1% |
| Maximum | 100.0% | 100.0% |
| Range | 44.5% | 78.9% |
| Mean | 90.7% | 77.1% |
| Median | 92.3% | 85.7% |
| Interquartile 25% (IQ1) | 88.0% | 60.3% |
| Interquartile 75% (IQ3) | 95.3% | 94.2% |
| Interquartile Range (IQR) | 7.3% | 33.8% |
| Standard Deviation (Sample) | 8.1% | 22.5% |
| Standard Deviation (Population) | 8.0% | 22.3% |
Similar Demographics by 1 or more Vehicles in Household
Demographics Similar to Immigrants from Greece by 1 or more Vehicles in Household
In terms of 1 or more vehicles in household, the demographic groups most similar to Immigrants from Greece are Moroccan (85.4%, a difference of 0.030%), Immigrants from Panama (85.4%, a difference of 0.050%), Immigrants from Russia (85.4%, a difference of 0.090%), Yuman (85.5%, a difference of 0.10%), and Immigrants from Ukraine (85.2%, a difference of 0.17%).
| Demographics | Rating | Rank | 1 or more Vehicles in Household |
| Immigrants | Spain | 0.0 /100 | #296 | Tragic 85.8% |
| Paraguayans | 0.0 /100 | #297 | Tragic 85.7% |
| Belizeans | 0.0 /100 | #298 | Tragic 85.7% |
| Yuman | 0.0 /100 | #299 | Tragic 85.5% |
| Immigrants | Russia | 0.0 /100 | #300 | Tragic 85.4% |
| Immigrants | Panama | 0.0 /100 | #301 | Tragic 85.4% |
| Moroccans | 0.0 /100 | #302 | Tragic 85.4% |
| Immigrants | Greece | 0.0 /100 | #303 | Tragic 85.4% |
| Immigrants | Ukraine | 0.0 /100 | #304 | Tragic 85.2% |
| Immigrants | China | 0.0 /100 | #305 | Tragic 84.9% |
| Immigrants | Western Africa | 0.0 /100 | #306 | Tragic 84.9% |
| Tohono O'odham | 0.0 /100 | #307 | Tragic 84.7% |
| Immigrants | Belize | 0.0 /100 | #308 | Tragic 84.7% |
| Immigrants | Haiti | 0.0 /100 | #309 | Tragic 84.7% |
| U.S. Virgin Islanders | 0.0 /100 | #310 | Tragic 84.6% |
Demographics Similar to Aleuts by 1 or more Vehicles in Household
In terms of 1 or more vehicles in household, the demographic groups most similar to Aleuts are Immigrants from Northern Africa (87.4%, a difference of 0.040%), Bermudan (87.5%, a difference of 0.060%), Panamanian (87.5%, a difference of 0.070%), Immigrants from Africa (87.6%, a difference of 0.080%), and Immigrants from Morocco (87.4%, a difference of 0.080%).
| Demographics | Rating | Rank | 1 or more Vehicles in Household |
| Africans | 0.4 /100 | #265 | Tragic 87.8% |
| Israelis | 0.3 /100 | #266 | Tragic 87.7% |
| Immigrants | Colombia | 0.3 /100 | #267 | Tragic 87.6% |
| Immigrants | Europe | 0.2 /100 | #268 | Tragic 87.6% |
| Immigrants | Africa | 0.2 /100 | #269 | Tragic 87.6% |
| Panamanians | 0.2 /100 | #270 | Tragic 87.5% |
| Bermudans | 0.2 /100 | #271 | Tragic 87.5% |
| Aleuts | 0.2 /100 | #272 | Tragic 87.5% |
| Immigrants | Northern Africa | 0.2 /100 | #273 | Tragic 87.4% |
| Immigrants | Morocco | 0.1 /100 | #274 | Tragic 87.4% |
| Immigrants | Singapore | 0.1 /100 | #275 | Tragic 87.2% |
| Immigrants | France | 0.1 /100 | #276 | Tragic 87.1% |
| Alsatians | 0.1 /100 | #277 | Tragic 87.1% |
| Immigrants | Southern Europe | 0.1 /100 | #278 | Tragic 87.1% |
| Immigrants | Albania | 0.1 /100 | #279 | Tragic 87.1% |