Nepalese vs Aleut 1 or more Vehicles in Household
COMPARE
Nepalese
Aleut
1 or more Vehicles in Household
1 or more Vehicles in Household Comparison
Nepalese
Aleuts
92.6%
1 OR MORE VEHICLES IN HOUSEHOLD
100.0/ 100
METRIC RATING
23rd/ 347
METRIC RANK
87.5%
1 OR MORE VEHICLES IN HOUSEHOLD
0.2/ 100
METRIC RATING
272nd/ 347
METRIC RANK
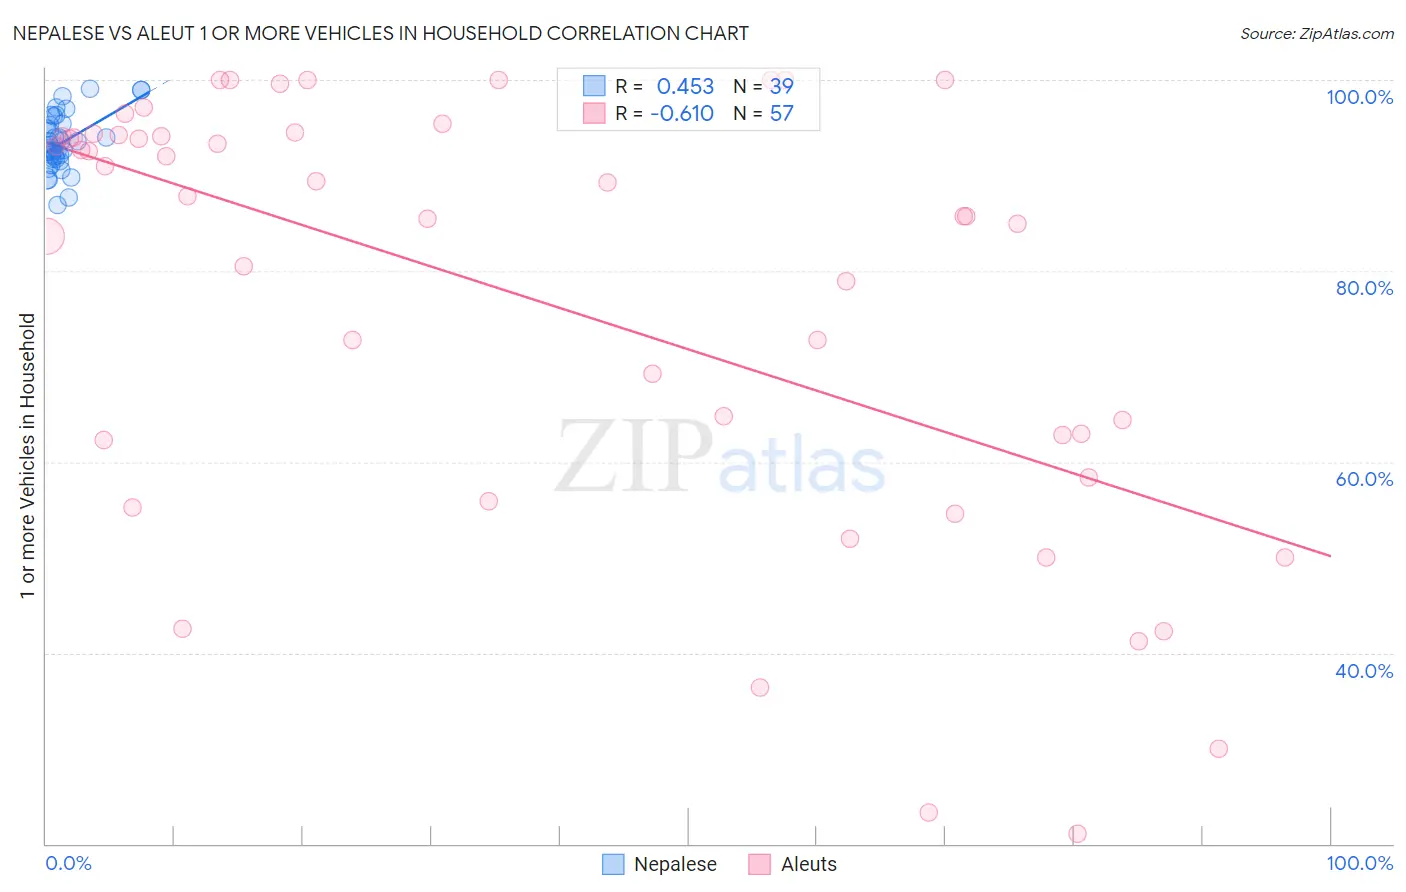
Nepalese vs Aleut 1 or more Vehicles in Household Correlation Chart
The statistical analysis conducted on geographies consisting of 24,483,296 people shows a moderate positive correlation between the proportion of Nepalese and percentage of households with 1 or more vehicles available in the United States with a correlation coefficient (R) of 0.453 and weighted average of 92.6%. Similarly, the statistical analysis conducted on geographies consisting of 61,775,894 people shows a significant negative correlation between the proportion of Aleuts and percentage of households with 1 or more vehicles available in the United States with a correlation coefficient (R) of -0.610 and weighted average of 87.5%, a difference of 5.9%.
1 or more Vehicles in Household Correlation Summary
| Measurement | Nepalese | Aleut |
| Minimum | 86.9% | 21.1% |
| Maximum | 99.1% | 100.0% |
| Range | 12.2% | 78.9% |
| Mean | 93.5% | 77.1% |
| Median | 93.2% | 85.7% |
| Interquartile 25% (IQ1) | 91.8% | 60.3% |
| Interquartile 75% (IQ3) | 95.5% | 94.2% |
| Interquartile Range (IQR) | 3.7% | 33.8% |
| Standard Deviation (Sample) | 3.0% | 22.5% |
| Standard Deviation (Population) | 2.9% | 22.3% |
Similar Demographics by 1 or more Vehicles in Household
Demographics Similar to Nepalese by 1 or more Vehicles in Household
In terms of 1 or more vehicles in household, the demographic groups most similar to Nepalese are French (92.7%, a difference of 0.070%), Yaqui (92.6%, a difference of 0.070%), Ottawa (92.7%, a difference of 0.080%), Immigrants from Iraq (92.5%, a difference of 0.090%), and Arapaho (92.7%, a difference of 0.10%).
| Demographics | Rating | Rank | 1 or more Vehicles in Household |
| Assyrians/Chaldeans/Syriacs | 100.0 /100 | #16 | Exceptional 93.0% |
| Europeans | 100.0 /100 | #17 | Exceptional 93.0% |
| Welsh | 100.0 /100 | #18 | Exceptional 93.0% |
| Tongans | 100.0 /100 | #19 | Exceptional 92.9% |
| Arapaho | 100.0 /100 | #20 | Exceptional 92.7% |
| Ottawa | 100.0 /100 | #21 | Exceptional 92.7% |
| French | 100.0 /100 | #22 | Exceptional 92.7% |
| Nepalese | 100.0 /100 | #23 | Exceptional 92.6% |
| Yaqui | 100.0 /100 | #24 | Exceptional 92.6% |
| Immigrants | Iraq | 100.0 /100 | #25 | Exceptional 92.5% |
| British | 100.0 /100 | #26 | Exceptional 92.5% |
| Americans | 100.0 /100 | #27 | Exceptional 92.5% |
| Sri Lankans | 100.0 /100 | #28 | Exceptional 92.5% |
| Native Hawaiians | 100.0 /100 | #29 | Exceptional 92.4% |
| Finns | 100.0 /100 | #30 | Exceptional 92.4% |
Demographics Similar to Aleuts by 1 or more Vehicles in Household
In terms of 1 or more vehicles in household, the demographic groups most similar to Aleuts are Immigrants from Northern Africa (87.4%, a difference of 0.040%), Bermudan (87.5%, a difference of 0.060%), Panamanian (87.5%, a difference of 0.070%), Immigrants from Africa (87.6%, a difference of 0.080%), and Immigrants from Morocco (87.4%, a difference of 0.080%).
| Demographics | Rating | Rank | 1 or more Vehicles in Household |
| Africans | 0.4 /100 | #265 | Tragic 87.8% |
| Israelis | 0.3 /100 | #266 | Tragic 87.7% |
| Immigrants | Colombia | 0.3 /100 | #267 | Tragic 87.6% |
| Immigrants | Europe | 0.2 /100 | #268 | Tragic 87.6% |
| Immigrants | Africa | 0.2 /100 | #269 | Tragic 87.6% |
| Panamanians | 0.2 /100 | #270 | Tragic 87.5% |
| Bermudans | 0.2 /100 | #271 | Tragic 87.5% |
| Aleuts | 0.2 /100 | #272 | Tragic 87.5% |
| Immigrants | Northern Africa | 0.2 /100 | #273 | Tragic 87.4% |
| Immigrants | Morocco | 0.1 /100 | #274 | Tragic 87.4% |
| Immigrants | Singapore | 0.1 /100 | #275 | Tragic 87.2% |
| Immigrants | France | 0.1 /100 | #276 | Tragic 87.1% |
| Alsatians | 0.1 /100 | #277 | Tragic 87.1% |
| Immigrants | Southern Europe | 0.1 /100 | #278 | Tragic 87.1% |
| Immigrants | Albania | 0.1 /100 | #279 | Tragic 87.1% |