Alaska Native vs Aleut 1 or more Vehicles in Household
COMPARE
Alaska Native
Aleut
1 or more Vehicles in Household
1 or more Vehicles in Household Comparison
Alaska Natives
Aleuts
83.8%
1 OR MORE VEHICLES IN HOUSEHOLD
0.0/ 100
METRIC RATING
316th/ 347
METRIC RANK
87.5%
1 OR MORE VEHICLES IN HOUSEHOLD
0.2/ 100
METRIC RATING
272nd/ 347
METRIC RANK
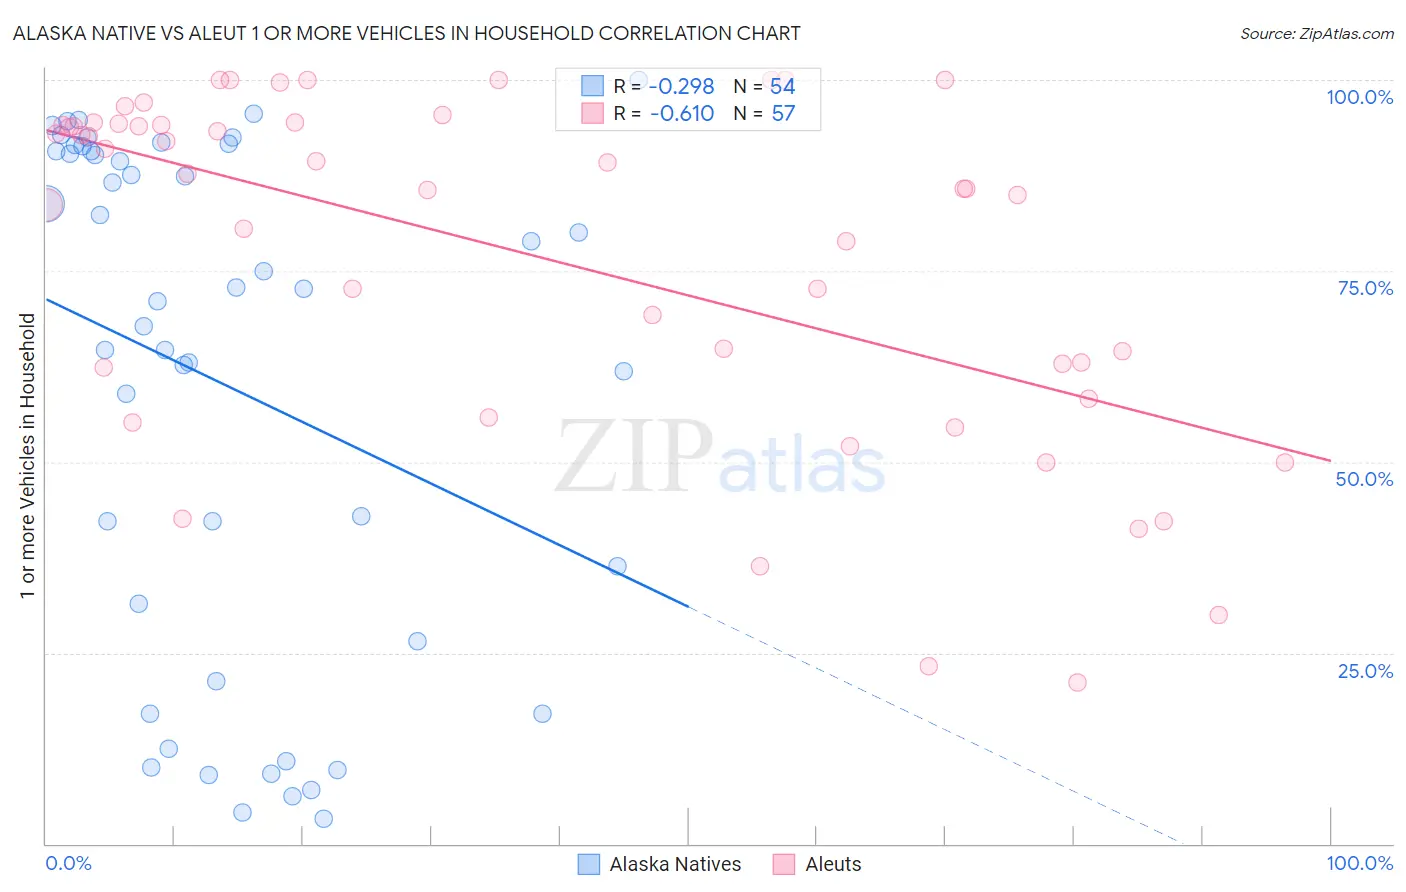
Alaska Native vs Aleut 1 or more Vehicles in Household Correlation Chart
The statistical analysis conducted on geographies consisting of 76,754,392 people shows a weak negative correlation between the proportion of Alaska Natives and percentage of households with 1 or more vehicles available in the United States with a correlation coefficient (R) of -0.298 and weighted average of 83.8%. Similarly, the statistical analysis conducted on geographies consisting of 61,775,894 people shows a significant negative correlation between the proportion of Aleuts and percentage of households with 1 or more vehicles available in the United States with a correlation coefficient (R) of -0.610 and weighted average of 87.5%, a difference of 4.4%.
1 or more Vehicles in Household Correlation Summary
| Measurement | Alaska Native | Aleut |
| Minimum | 3.3% | 21.1% |
| Maximum | 100.0% | 100.0% |
| Range | 96.7% | 78.9% |
| Mean | 60.3% | 77.1% |
| Median | 71.9% | 85.7% |
| Interquartile 25% (IQ1) | 26.5% | 60.3% |
| Interquartile 75% (IQ3) | 90.6% | 94.2% |
| Interquartile Range (IQR) | 64.1% | 33.8% |
| Standard Deviation (Sample) | 33.2% | 22.5% |
| Standard Deviation (Population) | 32.9% | 22.3% |
Similar Demographics by 1 or more Vehicles in Household
Demographics Similar to Alaska Natives by 1 or more Vehicles in Household
In terms of 1 or more vehicles in household, the demographic groups most similar to Alaska Natives are Ghanaian (83.6%, a difference of 0.22%), Immigrants from Ghana (83.4%, a difference of 0.42%), Immigrants from Belarus (83.3%, a difference of 0.55%), Cypriot (84.4%, a difference of 0.69%), and Albanian (84.4%, a difference of 0.76%).
| Demographics | Rating | Rank | 1 or more Vehicles in Household |
| Immigrants | Haiti | 0.0 /100 | #309 | Tragic 84.7% |
| U.S. Virgin Islanders | 0.0 /100 | #310 | Tragic 84.6% |
| Puerto Ricans | 0.0 /100 | #311 | Tragic 84.6% |
| Cape Verdeans | 0.0 /100 | #312 | Tragic 84.5% |
| Immigrants | Israel | 0.0 /100 | #313 | Tragic 84.5% |
| Albanians | 0.0 /100 | #314 | Tragic 84.4% |
| Cypriots | 0.0 /100 | #315 | Tragic 84.4% |
| Alaska Natives | 0.0 /100 | #316 | Tragic 83.8% |
| Ghanaians | 0.0 /100 | #317 | Tragic 83.6% |
| Immigrants | Ghana | 0.0 /100 | #318 | Tragic 83.4% |
| Immigrants | Belarus | 0.0 /100 | #319 | Tragic 83.3% |
| Soviet Union | 0.0 /100 | #320 | Tragic 82.7% |
| Jamaicans | 0.0 /100 | #321 | Tragic 82.1% |
| Immigrants | Cabo Verde | 0.0 /100 | #322 | Tragic 81.6% |
| Immigrants | Yemen | 0.0 /100 | #323 | Tragic 80.5% |
Demographics Similar to Aleuts by 1 or more Vehicles in Household
In terms of 1 or more vehicles in household, the demographic groups most similar to Aleuts are Immigrants from Northern Africa (87.4%, a difference of 0.040%), Bermudan (87.5%, a difference of 0.060%), Panamanian (87.5%, a difference of 0.070%), Immigrants from Africa (87.6%, a difference of 0.080%), and Immigrants from Morocco (87.4%, a difference of 0.080%).
| Demographics | Rating | Rank | 1 or more Vehicles in Household |
| Africans | 0.4 /100 | #265 | Tragic 87.8% |
| Israelis | 0.3 /100 | #266 | Tragic 87.7% |
| Immigrants | Colombia | 0.3 /100 | #267 | Tragic 87.6% |
| Immigrants | Europe | 0.2 /100 | #268 | Tragic 87.6% |
| Immigrants | Africa | 0.2 /100 | #269 | Tragic 87.6% |
| Panamanians | 0.2 /100 | #270 | Tragic 87.5% |
| Bermudans | 0.2 /100 | #271 | Tragic 87.5% |
| Aleuts | 0.2 /100 | #272 | Tragic 87.5% |
| Immigrants | Northern Africa | 0.2 /100 | #273 | Tragic 87.4% |
| Immigrants | Morocco | 0.1 /100 | #274 | Tragic 87.4% |
| Immigrants | Singapore | 0.1 /100 | #275 | Tragic 87.2% |
| Immigrants | France | 0.1 /100 | #276 | Tragic 87.1% |
| Alsatians | 0.1 /100 | #277 | Tragic 87.1% |
| Immigrants | Southern Europe | 0.1 /100 | #278 | Tragic 87.1% |
| Immigrants | Albania | 0.1 /100 | #279 | Tragic 87.1% |