Immigrants from Greece vs Senegalese 1 or more Vehicles in Household
COMPARE
Immigrants from Greece
Senegalese
1 or more Vehicles in Household
1 or more Vehicles in Household Comparison
Immigrants from Greece
Senegalese
85.4%
1 OR MORE VEHICLES IN HOUSEHOLD
0.0/ 100
METRIC RATING
303rd/ 347
METRIC RANK
80.4%
1 OR MORE VEHICLES IN HOUSEHOLD
0.0/ 100
METRIC RATING
325th/ 347
METRIC RANK
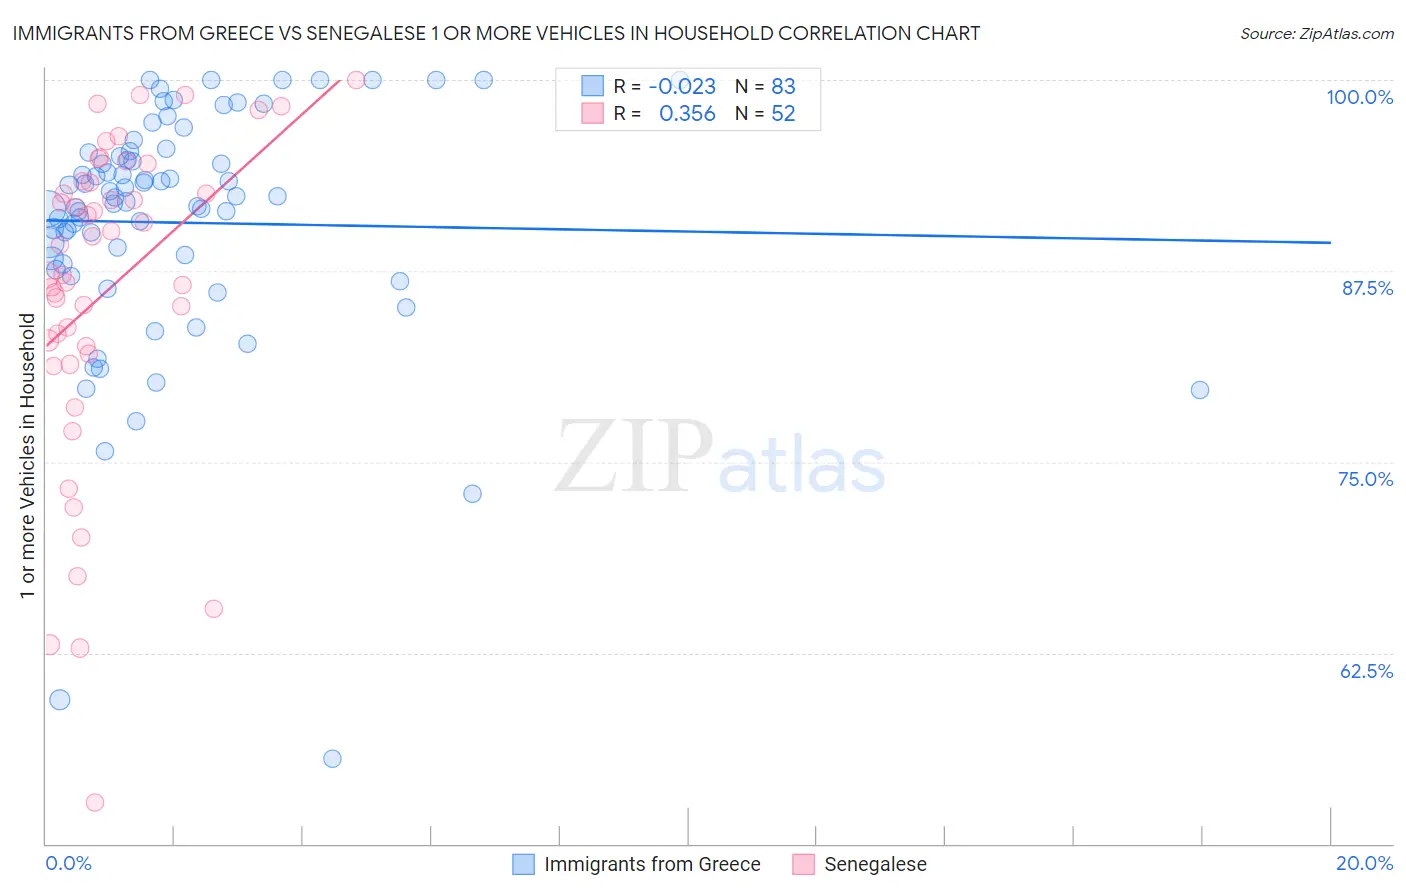
Immigrants from Greece vs Senegalese 1 or more Vehicles in Household Correlation Chart
The statistical analysis conducted on geographies consisting of 216,749,502 people shows no correlation between the proportion of Immigrants from Greece and percentage of households with 1 or more vehicles available in the United States with a correlation coefficient (R) of -0.023 and weighted average of 85.4%. Similarly, the statistical analysis conducted on geographies consisting of 78,083,411 people shows a mild positive correlation between the proportion of Senegalese and percentage of households with 1 or more vehicles available in the United States with a correlation coefficient (R) of 0.356 and weighted average of 80.4%, a difference of 6.2%.
1 or more Vehicles in Household Correlation Summary
| Measurement | Immigrants from Greece | Senegalese |
| Minimum | 55.5% | 52.7% |
| Maximum | 100.0% | 100.0% |
| Range | 44.5% | 47.3% |
| Mean | 90.7% | 86.2% |
| Median | 92.3% | 88.2% |
| Interquartile 25% (IQ1) | 88.0% | 82.3% |
| Interquartile 75% (IQ3) | 95.3% | 93.3% |
| Interquartile Range (IQR) | 7.3% | 11.0% |
| Standard Deviation (Sample) | 8.1% | 10.6% |
| Standard Deviation (Population) | 8.0% | 10.5% |
Similar Demographics by 1 or more Vehicles in Household
Demographics Similar to Immigrants from Greece by 1 or more Vehicles in Household
In terms of 1 or more vehicles in household, the demographic groups most similar to Immigrants from Greece are Moroccan (85.4%, a difference of 0.030%), Immigrants from Panama (85.4%, a difference of 0.050%), Immigrants from Russia (85.4%, a difference of 0.090%), Yuman (85.5%, a difference of 0.10%), and Immigrants from Ukraine (85.2%, a difference of 0.17%).
| Demographics | Rating | Rank | 1 or more Vehicles in Household |
| Immigrants | Spain | 0.0 /100 | #296 | Tragic 85.8% |
| Paraguayans | 0.0 /100 | #297 | Tragic 85.7% |
| Belizeans | 0.0 /100 | #298 | Tragic 85.7% |
| Yuman | 0.0 /100 | #299 | Tragic 85.5% |
| Immigrants | Russia | 0.0 /100 | #300 | Tragic 85.4% |
| Immigrants | Panama | 0.0 /100 | #301 | Tragic 85.4% |
| Moroccans | 0.0 /100 | #302 | Tragic 85.4% |
| Immigrants | Greece | 0.0 /100 | #303 | Tragic 85.4% |
| Immigrants | Ukraine | 0.0 /100 | #304 | Tragic 85.2% |
| Immigrants | China | 0.0 /100 | #305 | Tragic 84.9% |
| Immigrants | Western Africa | 0.0 /100 | #306 | Tragic 84.9% |
| Tohono O'odham | 0.0 /100 | #307 | Tragic 84.7% |
| Immigrants | Belize | 0.0 /100 | #308 | Tragic 84.7% |
| Immigrants | Haiti | 0.0 /100 | #309 | Tragic 84.7% |
| U.S. Virgin Islanders | 0.0 /100 | #310 | Tragic 84.6% |
Demographics Similar to Senegalese by 1 or more Vehicles in Household
In terms of 1 or more vehicles in household, the demographic groups most similar to Senegalese are Immigrants from Caribbean (80.4%, a difference of 0.10%), Immigrants from Yemen (80.5%, a difference of 0.22%), Immigrants from West Indies (79.5%, a difference of 1.1%), Immigrants from Cabo Verde (81.6%, a difference of 1.5%), and Immigrants from Senegal (79.0%, a difference of 1.7%).
| Demographics | Rating | Rank | 1 or more Vehicles in Household |
| Immigrants | Ghana | 0.0 /100 | #318 | Tragic 83.4% |
| Immigrants | Belarus | 0.0 /100 | #319 | Tragic 83.3% |
| Soviet Union | 0.0 /100 | #320 | Tragic 82.7% |
| Jamaicans | 0.0 /100 | #321 | Tragic 82.1% |
| Immigrants | Cabo Verde | 0.0 /100 | #322 | Tragic 81.6% |
| Immigrants | Yemen | 0.0 /100 | #323 | Tragic 80.5% |
| Immigrants | Caribbean | 0.0 /100 | #324 | Tragic 80.4% |
| Senegalese | 0.0 /100 | #325 | Tragic 80.4% |
| Immigrants | West Indies | 0.0 /100 | #326 | Tragic 79.5% |
| Immigrants | Senegal | 0.0 /100 | #327 | Tragic 79.0% |
| Ecuadorians | 0.0 /100 | #328 | Tragic 77.9% |
| Immigrants | Dominica | 0.0 /100 | #329 | Tragic 77.8% |
| Immigrants | Trinidad and Tobago | 0.0 /100 | #330 | Tragic 76.8% |
| West Indians | 0.0 /100 | #331 | Tragic 76.4% |
| Trinidadians and Tobagonians | 0.0 /100 | #332 | Tragic 76.3% |