Sioux vs Aleut 1 or more Vehicles in Household
COMPARE
Sioux
Aleut
1 or more Vehicles in Household
1 or more Vehicles in Household Comparison
Sioux
Aleuts
90.2%
1 OR MORE VEHICLES IN HOUSEHOLD
81.3/ 100
METRIC RATING
145th/ 347
METRIC RANK
87.5%
1 OR MORE VEHICLES IN HOUSEHOLD
0.2/ 100
METRIC RATING
272nd/ 347
METRIC RANK
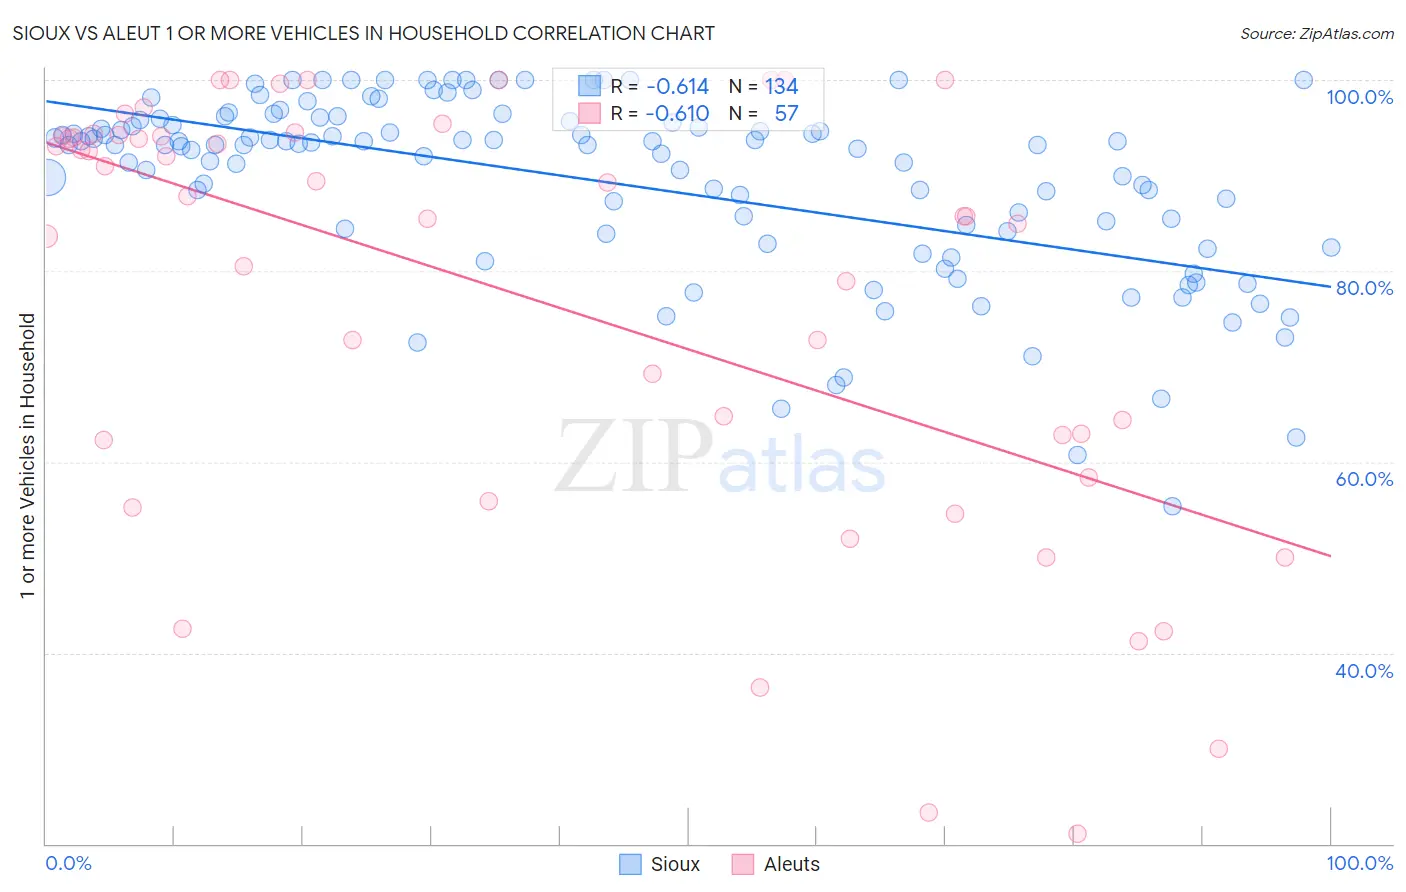
Sioux vs Aleut 1 or more Vehicles in Household Correlation Chart
The statistical analysis conducted on geographies consisting of 234,124,417 people shows a significant negative correlation between the proportion of Sioux and percentage of households with 1 or more vehicles available in the United States with a correlation coefficient (R) of -0.614 and weighted average of 90.2%. Similarly, the statistical analysis conducted on geographies consisting of 61,775,894 people shows a significant negative correlation between the proportion of Aleuts and percentage of households with 1 or more vehicles available in the United States with a correlation coefficient (R) of -0.610 and weighted average of 87.5%, a difference of 3.1%.
1 or more Vehicles in Household Correlation Summary
| Measurement | Sioux | Aleut |
| Minimum | 55.3% | 21.1% |
| Maximum | 100.0% | 100.0% |
| Range | 44.7% | 78.9% |
| Mean | 89.3% | 77.1% |
| Median | 93.2% | 85.7% |
| Interquartile 25% (IQ1) | 84.2% | 60.3% |
| Interquartile 75% (IQ3) | 95.5% | 94.2% |
| Interquartile Range (IQR) | 11.3% | 33.8% |
| Standard Deviation (Sample) | 9.5% | 22.5% |
| Standard Deviation (Population) | 9.5% | 22.3% |
Similar Demographics by 1 or more Vehicles in Household
Demographics Similar to Sioux by 1 or more Vehicles in Household
In terms of 1 or more vehicles in household, the demographic groups most similar to Sioux are Immigrants from Zimbabwe (90.2%, a difference of 0.0%), Immigrants from Bahamas (90.2%, a difference of 0.010%), Bahamian (90.2%, a difference of 0.020%), Immigrants from Lithuania (90.2%, a difference of 0.040%), and Chilean (90.2%, a difference of 0.040%).
| Demographics | Rating | Rank | 1 or more Vehicles in Household |
| Syrians | 86.3 /100 | #138 | Excellent 90.3% |
| Estonians | 85.6 /100 | #139 | Excellent 90.3% |
| Sudanese | 85.2 /100 | #140 | Excellent 90.3% |
| Immigrants | Moldova | 83.1 /100 | #141 | Excellent 90.2% |
| Immigrants | Lithuania | 83.0 /100 | #142 | Excellent 90.2% |
| Immigrants | Bahamas | 81.5 /100 | #143 | Excellent 90.2% |
| Immigrants | Zimbabwe | 81.5 /100 | #144 | Excellent 90.2% |
| Sioux | 81.3 /100 | #145 | Excellent 90.2% |
| Bahamians | 80.5 /100 | #146 | Excellent 90.2% |
| Chileans | 79.8 /100 | #147 | Good 90.2% |
| Immigrants | Eastern Africa | 78.2 /100 | #148 | Good 90.1% |
| Immigrants | Nicaragua | 76.7 /100 | #149 | Good 90.1% |
| Immigrants | Micronesia | 75.9 /100 | #150 | Good 90.1% |
| Immigrants | Bosnia and Herzegovina | 75.4 /100 | #151 | Good 90.1% |
| Tlingit-Haida | 74.3 /100 | #152 | Good 90.1% |
Demographics Similar to Aleuts by 1 or more Vehicles in Household
In terms of 1 or more vehicles in household, the demographic groups most similar to Aleuts are Immigrants from Northern Africa (87.4%, a difference of 0.040%), Bermudan (87.5%, a difference of 0.060%), Panamanian (87.5%, a difference of 0.070%), Immigrants from Africa (87.6%, a difference of 0.080%), and Immigrants from Morocco (87.4%, a difference of 0.080%).
| Demographics | Rating | Rank | 1 or more Vehicles in Household |
| Africans | 0.4 /100 | #265 | Tragic 87.8% |
| Israelis | 0.3 /100 | #266 | Tragic 87.7% |
| Immigrants | Colombia | 0.3 /100 | #267 | Tragic 87.6% |
| Immigrants | Europe | 0.2 /100 | #268 | Tragic 87.6% |
| Immigrants | Africa | 0.2 /100 | #269 | Tragic 87.6% |
| Panamanians | 0.2 /100 | #270 | Tragic 87.5% |
| Bermudans | 0.2 /100 | #271 | Tragic 87.5% |
| Aleuts | 0.2 /100 | #272 | Tragic 87.5% |
| Immigrants | Northern Africa | 0.2 /100 | #273 | Tragic 87.4% |
| Immigrants | Morocco | 0.1 /100 | #274 | Tragic 87.4% |
| Immigrants | Singapore | 0.1 /100 | #275 | Tragic 87.2% |
| Immigrants | France | 0.1 /100 | #276 | Tragic 87.1% |
| Alsatians | 0.1 /100 | #277 | Tragic 87.1% |
| Immigrants | Southern Europe | 0.1 /100 | #278 | Tragic 87.1% |
| Immigrants | Albania | 0.1 /100 | #279 | Tragic 87.1% |