Immigrants from Greece vs Afghan 1 or more Vehicles in Household
COMPARE
Immigrants from Greece
Afghan
1 or more Vehicles in Household
1 or more Vehicles in Household Comparison
Immigrants from Greece
Afghans
85.4%
1 OR MORE VEHICLES IN HOUSEHOLD
0.0/ 100
METRIC RATING
303rd/ 347
METRIC RANK
92.1%
1 OR MORE VEHICLES IN HOUSEHOLD
99.9/ 100
METRIC RATING
49th/ 347
METRIC RANK
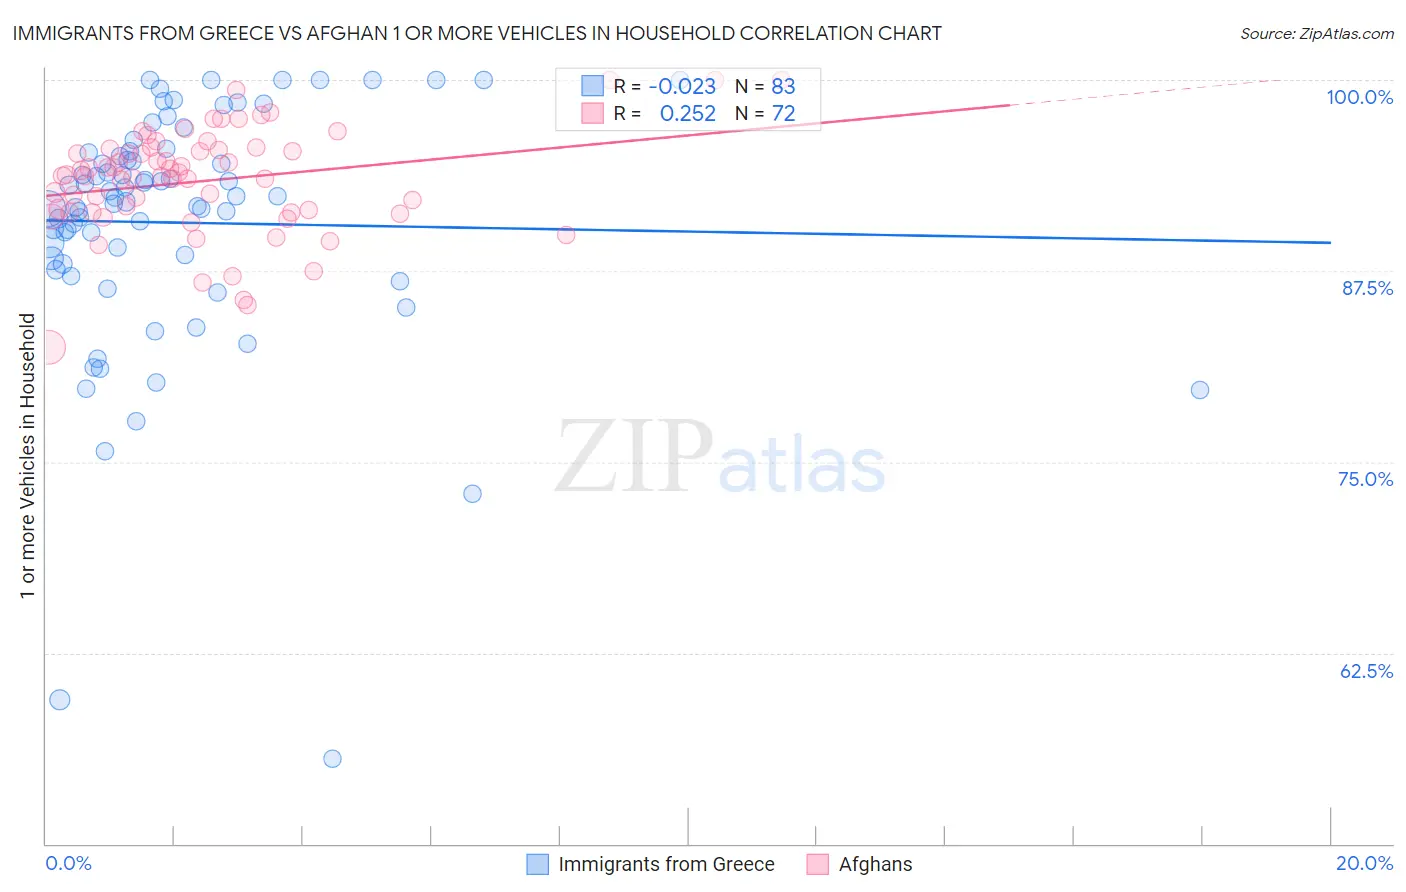
Immigrants from Greece vs Afghan 1 or more Vehicles in Household Correlation Chart
The statistical analysis conducted on geographies consisting of 216,749,502 people shows no correlation between the proportion of Immigrants from Greece and percentage of households with 1 or more vehicles available in the United States with a correlation coefficient (R) of -0.023 and weighted average of 85.4%. Similarly, the statistical analysis conducted on geographies consisting of 148,819,650 people shows a weak positive correlation between the proportion of Afghans and percentage of households with 1 or more vehicles available in the United States with a correlation coefficient (R) of 0.252 and weighted average of 92.1%, a difference of 7.9%.
1 or more Vehicles in Household Correlation Summary
| Measurement | Immigrants from Greece | Afghan |
| Minimum | 55.5% | 82.5% |
| Maximum | 100.0% | 100.0% |
| Range | 44.5% | 17.5% |
| Mean | 90.7% | 93.4% |
| Median | 92.3% | 93.8% |
| Interquartile 25% (IQ1) | 88.0% | 91.3% |
| Interquartile 75% (IQ3) | 95.3% | 95.4% |
| Interquartile Range (IQR) | 7.3% | 4.1% |
| Standard Deviation (Sample) | 8.1% | 3.5% |
| Standard Deviation (Population) | 8.0% | 3.4% |
Similar Demographics by 1 or more Vehicles in Household
Demographics Similar to Immigrants from Greece by 1 or more Vehicles in Household
In terms of 1 or more vehicles in household, the demographic groups most similar to Immigrants from Greece are Moroccan (85.4%, a difference of 0.030%), Immigrants from Panama (85.4%, a difference of 0.050%), Immigrants from Russia (85.4%, a difference of 0.090%), Yuman (85.5%, a difference of 0.10%), and Immigrants from Ukraine (85.2%, a difference of 0.17%).
| Demographics | Rating | Rank | 1 or more Vehicles in Household |
| Immigrants | Spain | 0.0 /100 | #296 | Tragic 85.8% |
| Paraguayans | 0.0 /100 | #297 | Tragic 85.7% |
| Belizeans | 0.0 /100 | #298 | Tragic 85.7% |
| Yuman | 0.0 /100 | #299 | Tragic 85.5% |
| Immigrants | Russia | 0.0 /100 | #300 | Tragic 85.4% |
| Immigrants | Panama | 0.0 /100 | #301 | Tragic 85.4% |
| Moroccans | 0.0 /100 | #302 | Tragic 85.4% |
| Immigrants | Greece | 0.0 /100 | #303 | Tragic 85.4% |
| Immigrants | Ukraine | 0.0 /100 | #304 | Tragic 85.2% |
| Immigrants | China | 0.0 /100 | #305 | Tragic 84.9% |
| Immigrants | Western Africa | 0.0 /100 | #306 | Tragic 84.9% |
| Tohono O'odham | 0.0 /100 | #307 | Tragic 84.7% |
| Immigrants | Belize | 0.0 /100 | #308 | Tragic 84.7% |
| Immigrants | Haiti | 0.0 /100 | #309 | Tragic 84.7% |
| U.S. Virgin Islanders | 0.0 /100 | #310 | Tragic 84.6% |
Demographics Similar to Afghans by 1 or more Vehicles in Household
In terms of 1 or more vehicles in household, the demographic groups most similar to Afghans are Belgian (92.1%, a difference of 0.010%), Guamanian/Chamorro (92.1%, a difference of 0.010%), Celtic (92.1%, a difference of 0.020%), Korean (92.1%, a difference of 0.050%), and Hawaiian (92.0%, a difference of 0.080%).
| Demographics | Rating | Rank | 1 or more Vehicles in Household |
| Chickasaw | 99.9 /100 | #42 | Exceptional 92.3% |
| Spanish | 99.9 /100 | #43 | Exceptional 92.3% |
| Choctaw | 99.9 /100 | #44 | Exceptional 92.2% |
| Immigrants | Nonimmigrants | 99.9 /100 | #45 | Exceptional 92.2% |
| Immigrants | Fiji | 99.9 /100 | #46 | Exceptional 92.2% |
| Northern Europeans | 99.9 /100 | #47 | Exceptional 92.2% |
| Belgians | 99.9 /100 | #48 | Exceptional 92.1% |
| Afghans | 99.9 /100 | #49 | Exceptional 92.1% |
| Guamanians/Chamorros | 99.9 /100 | #50 | Exceptional 92.1% |
| Celtics | 99.9 /100 | #51 | Exceptional 92.1% |
| Koreans | 99.9 /100 | #52 | Exceptional 92.1% |
| Hawaiians | 99.9 /100 | #53 | Exceptional 92.0% |
| Slovenes | 99.9 /100 | #54 | Exceptional 92.0% |
| Immigrants | Afghanistan | 99.9 /100 | #55 | Exceptional 92.0% |
| Immigrants | Venezuela | 99.9 /100 | #56 | Exceptional 92.0% |