Immigrants from Greece vs South American Indian 1 or more Vehicles in Household
COMPARE
Immigrants from Greece
South American Indian
1 or more Vehicles in Household
1 or more Vehicles in Household Comparison
Immigrants from Greece
South American Indians
85.4%
1 OR MORE VEHICLES IN HOUSEHOLD
0.0/ 100
METRIC RATING
303rd/ 347
METRIC RANK
88.0%
1 OR MORE VEHICLES IN HOUSEHOLD
0.9/ 100
METRIC RATING
258th/ 347
METRIC RANK
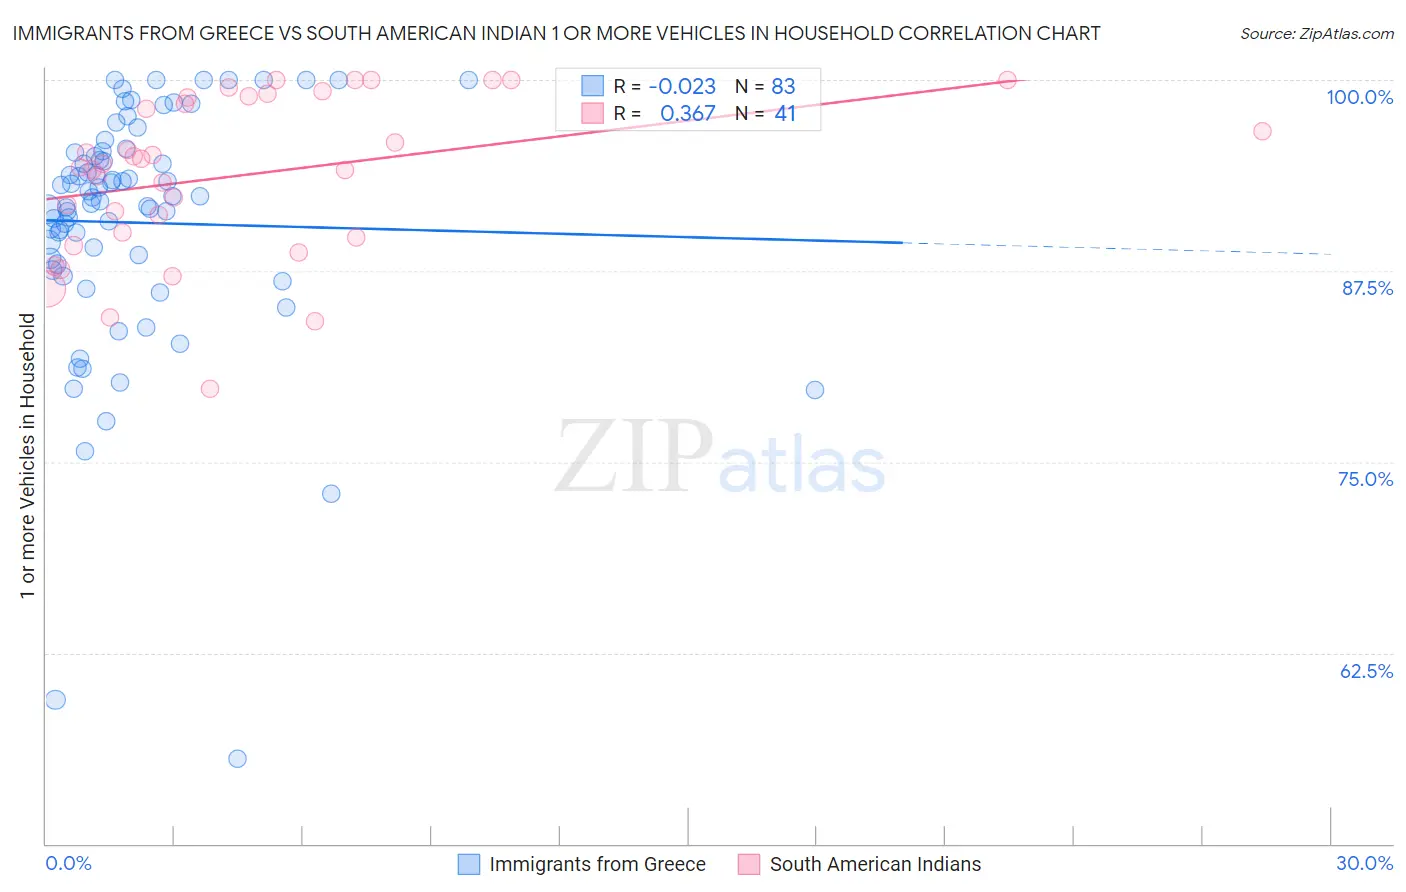
Immigrants from Greece vs South American Indian 1 or more Vehicles in Household Correlation Chart
The statistical analysis conducted on geographies consisting of 216,749,502 people shows no correlation between the proportion of Immigrants from Greece and percentage of households with 1 or more vehicles available in the United States with a correlation coefficient (R) of -0.023 and weighted average of 85.4%. Similarly, the statistical analysis conducted on geographies consisting of 164,540,397 people shows a mild positive correlation between the proportion of South American Indians and percentage of households with 1 or more vehicles available in the United States with a correlation coefficient (R) of 0.367 and weighted average of 88.0%, a difference of 3.1%.
1 or more Vehicles in Household Correlation Summary
| Measurement | Immigrants from Greece | South American Indian |
| Minimum | 55.5% | 79.8% |
| Maximum | 100.0% | 100.0% |
| Range | 44.5% | 20.2% |
| Mean | 90.7% | 93.8% |
| Median | 92.3% | 94.5% |
| Interquartile 25% (IQ1) | 88.0% | 89.9% |
| Interquartile 75% (IQ3) | 95.3% | 98.9% |
| Interquartile Range (IQR) | 7.3% | 9.0% |
| Standard Deviation (Sample) | 8.1% | 5.2% |
| Standard Deviation (Population) | 8.0% | 5.1% |
Similar Demographics by 1 or more Vehicles in Household
Demographics Similar to Immigrants from Greece by 1 or more Vehicles in Household
In terms of 1 or more vehicles in household, the demographic groups most similar to Immigrants from Greece are Moroccan (85.4%, a difference of 0.030%), Immigrants from Panama (85.4%, a difference of 0.050%), Immigrants from Russia (85.4%, a difference of 0.090%), Yuman (85.5%, a difference of 0.10%), and Immigrants from Ukraine (85.2%, a difference of 0.17%).
| Demographics | Rating | Rank | 1 or more Vehicles in Household |
| Immigrants | Spain | 0.0 /100 | #296 | Tragic 85.8% |
| Paraguayans | 0.0 /100 | #297 | Tragic 85.7% |
| Belizeans | 0.0 /100 | #298 | Tragic 85.7% |
| Yuman | 0.0 /100 | #299 | Tragic 85.5% |
| Immigrants | Russia | 0.0 /100 | #300 | Tragic 85.4% |
| Immigrants | Panama | 0.0 /100 | #301 | Tragic 85.4% |
| Moroccans | 0.0 /100 | #302 | Tragic 85.4% |
| Immigrants | Greece | 0.0 /100 | #303 | Tragic 85.4% |
| Immigrants | Ukraine | 0.0 /100 | #304 | Tragic 85.2% |
| Immigrants | China | 0.0 /100 | #305 | Tragic 84.9% |
| Immigrants | Western Africa | 0.0 /100 | #306 | Tragic 84.9% |
| Tohono O'odham | 0.0 /100 | #307 | Tragic 84.7% |
| Immigrants | Belize | 0.0 /100 | #308 | Tragic 84.7% |
| Immigrants | Haiti | 0.0 /100 | #309 | Tragic 84.7% |
| U.S. Virgin Islanders | 0.0 /100 | #310 | Tragic 84.6% |
Demographics Similar to South American Indians by 1 or more Vehicles in Household
In terms of 1 or more vehicles in household, the demographic groups most similar to South American Indians are Liberian (88.0%, a difference of 0.0%), Immigrants from Latvia (88.1%, a difference of 0.010%), Colombian (88.0%, a difference of 0.010%), Nigerian (88.0%, a difference of 0.030%), and Honduran (88.1%, a difference of 0.040%).
| Demographics | Rating | Rank | 1 or more Vehicles in Household |
| Immigrants | Serbia | 1.2 /100 | #251 | Tragic 88.2% |
| Immigrants | Uruguay | 1.1 /100 | #252 | Tragic 88.1% |
| Hondurans | 1.0 /100 | #253 | Tragic 88.1% |
| Haitians | 0.9 /100 | #254 | Tragic 88.1% |
| Immigrants | Latvia | 0.9 /100 | #255 | Tragic 88.1% |
| Colombians | 0.9 /100 | #256 | Tragic 88.0% |
| Liberians | 0.9 /100 | #257 | Tragic 88.0% |
| South American Indians | 0.9 /100 | #258 | Tragic 88.0% |
| Nigerians | 0.8 /100 | #259 | Tragic 88.0% |
| Macedonians | 0.6 /100 | #260 | Tragic 87.9% |
| Immigrants | Switzerland | 0.6 /100 | #261 | Tragic 87.9% |
| Sub-Saharan Africans | 0.5 /100 | #262 | Tragic 87.9% |
| Immigrants | Egypt | 0.5 /100 | #263 | Tragic 87.8% |
| Immigrants | Liberia | 0.4 /100 | #264 | Tragic 87.8% |
| Africans | 0.4 /100 | #265 | Tragic 87.8% |