Hispanic or Latino vs Aleut 1 or more Vehicles in Household
COMPARE
Hispanic or Latino
Aleut
1 or more Vehicles in Household
1 or more Vehicles in Household Comparison
Hispanics or Latinos
Aleuts
91.0%
1 OR MORE VEHICLES IN HOUSEHOLD
97.6/ 100
METRIC RATING
108th/ 347
METRIC RANK
87.5%
1 OR MORE VEHICLES IN HOUSEHOLD
0.2/ 100
METRIC RATING
272nd/ 347
METRIC RANK
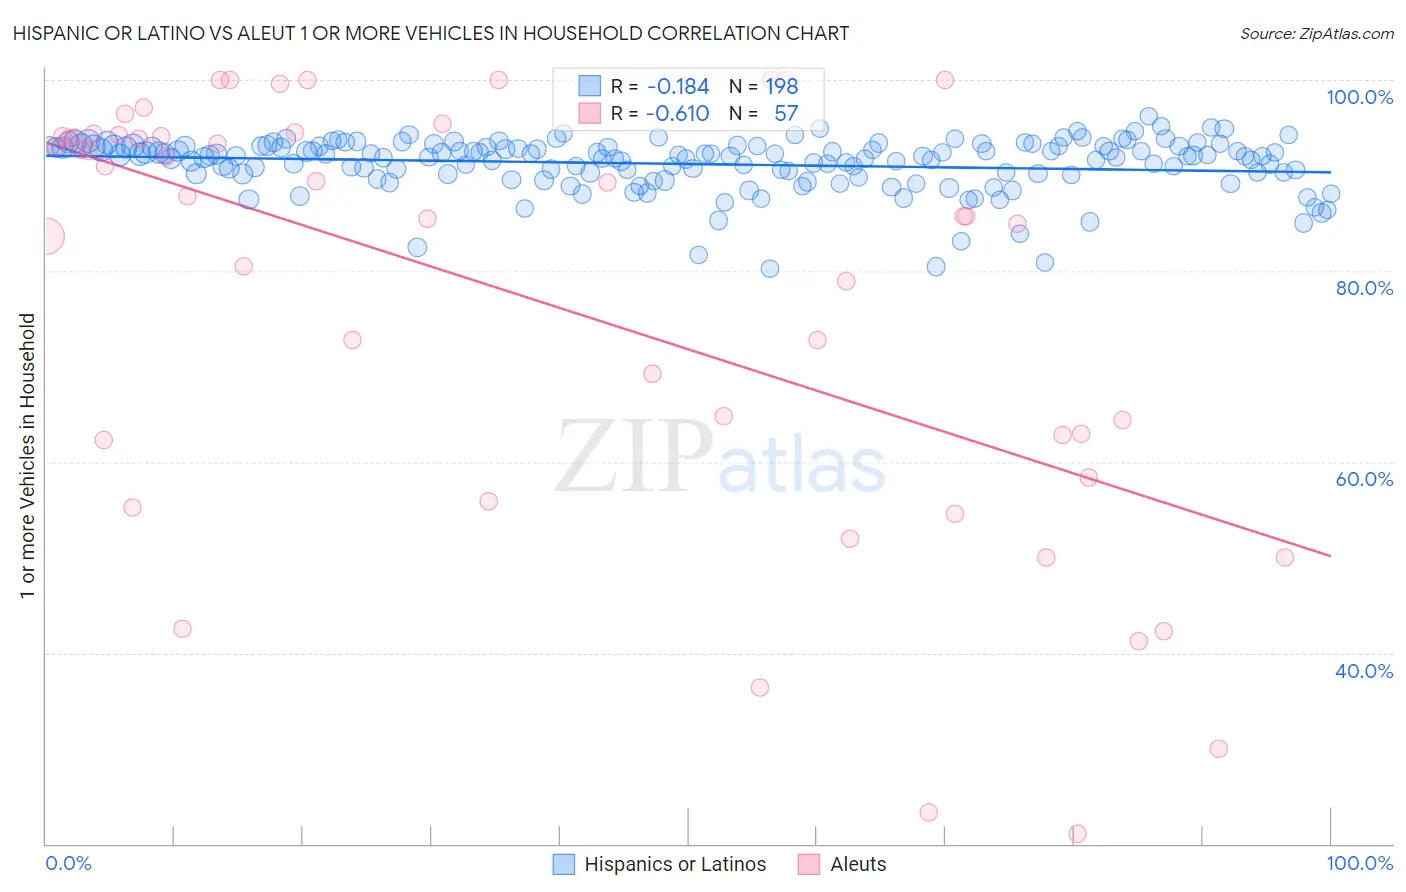
Hispanic or Latino vs Aleut 1 or more Vehicles in Household Correlation Chart
The statistical analysis conducted on geographies consisting of 564,196,791 people shows a poor negative correlation between the proportion of Hispanics or Latinos and percentage of households with 1 or more vehicles available in the United States with a correlation coefficient (R) of -0.184 and weighted average of 91.0%. Similarly, the statistical analysis conducted on geographies consisting of 61,775,894 people shows a significant negative correlation between the proportion of Aleuts and percentage of households with 1 or more vehicles available in the United States with a correlation coefficient (R) of -0.610 and weighted average of 87.5%, a difference of 4.0%.
1 or more Vehicles in Household Correlation Summary
| Measurement | Hispanic or Latino | Aleut |
| Minimum | 80.2% | 21.1% |
| Maximum | 96.2% | 100.0% |
| Range | 16.0% | 78.9% |
| Mean | 91.2% | 77.1% |
| Median | 92.0% | 85.7% |
| Interquartile 25% (IQ1) | 90.2% | 60.3% |
| Interquartile 75% (IQ3) | 93.0% | 94.2% |
| Interquartile Range (IQR) | 2.8% | 33.8% |
| Standard Deviation (Sample) | 2.8% | 22.5% |
| Standard Deviation (Population) | 2.8% | 22.3% |
Similar Demographics by 1 or more Vehicles in Household
Demographics Similar to Hispanics or Latinos by 1 or more Vehicles in Household
In terms of 1 or more vehicles in household, the demographic groups most similar to Hispanics or Latinos are Maltese (91.0%, a difference of 0.0%), Delaware (91.0%, a difference of 0.0%), Zimbabwean (91.0%, a difference of 0.020%), Mexican American Indian (91.0%, a difference of 0.030%), and Laotian (91.0%, a difference of 0.060%).
| Demographics | Rating | Rank | 1 or more Vehicles in Household |
| Bulgarians | 98.4 /100 | #101 | Exceptional 91.1% |
| Seminole | 98.3 /100 | #102 | Exceptional 91.1% |
| Yugoslavians | 98.3 /100 | #103 | Exceptional 91.1% |
| Asians | 98.2 /100 | #104 | Exceptional 91.1% |
| Laotians | 98.0 /100 | #105 | Exceptional 91.0% |
| Zimbabweans | 97.7 /100 | #106 | Exceptional 91.0% |
| Maltese | 97.7 /100 | #107 | Exceptional 91.0% |
| Hispanics or Latinos | 97.6 /100 | #108 | Exceptional 91.0% |
| Delaware | 97.6 /100 | #109 | Exceptional 91.0% |
| Mexican American Indians | 97.4 /100 | #110 | Exceptional 91.0% |
| Navajo | 95.8 /100 | #111 | Exceptional 90.8% |
| Immigrants | Netherlands | 95.7 /100 | #112 | Exceptional 90.8% |
| Immigrants | Kuwait | 94.7 /100 | #113 | Exceptional 90.7% |
| Armenians | 94.5 /100 | #114 | Exceptional 90.7% |
| Serbians | 94.3 /100 | #115 | Exceptional 90.7% |
Demographics Similar to Aleuts by 1 or more Vehicles in Household
In terms of 1 or more vehicles in household, the demographic groups most similar to Aleuts are Immigrants from Northern Africa (87.4%, a difference of 0.040%), Bermudan (87.5%, a difference of 0.060%), Panamanian (87.5%, a difference of 0.070%), Immigrants from Africa (87.6%, a difference of 0.080%), and Immigrants from Morocco (87.4%, a difference of 0.080%).
| Demographics | Rating | Rank | 1 or more Vehicles in Household |
| Africans | 0.4 /100 | #265 | Tragic 87.8% |
| Israelis | 0.3 /100 | #266 | Tragic 87.7% |
| Immigrants | Colombia | 0.3 /100 | #267 | Tragic 87.6% |
| Immigrants | Europe | 0.2 /100 | #268 | Tragic 87.6% |
| Immigrants | Africa | 0.2 /100 | #269 | Tragic 87.6% |
| Panamanians | 0.2 /100 | #270 | Tragic 87.5% |
| Bermudans | 0.2 /100 | #271 | Tragic 87.5% |
| Aleuts | 0.2 /100 | #272 | Tragic 87.5% |
| Immigrants | Northern Africa | 0.2 /100 | #273 | Tragic 87.4% |
| Immigrants | Morocco | 0.1 /100 | #274 | Tragic 87.4% |
| Immigrants | Singapore | 0.1 /100 | #275 | Tragic 87.2% |
| Immigrants | France | 0.1 /100 | #276 | Tragic 87.1% |
| Alsatians | 0.1 /100 | #277 | Tragic 87.1% |
| Immigrants | Southern Europe | 0.1 /100 | #278 | Tragic 87.1% |
| Immigrants | Albania | 0.1 /100 | #279 | Tragic 87.1% |