Immigrants from Greece vs Immigrants from Yemen 1 or more Vehicles in Household
COMPARE
Immigrants from Greece
Immigrants from Yemen
1 or more Vehicles in Household
1 or more Vehicles in Household Comparison
Immigrants from Greece
Immigrants from Yemen
85.4%
1 OR MORE VEHICLES IN HOUSEHOLD
0.0/ 100
METRIC RATING
303rd/ 347
METRIC RANK
80.5%
1 OR MORE VEHICLES IN HOUSEHOLD
0.0/ 100
METRIC RATING
323rd/ 347
METRIC RANK
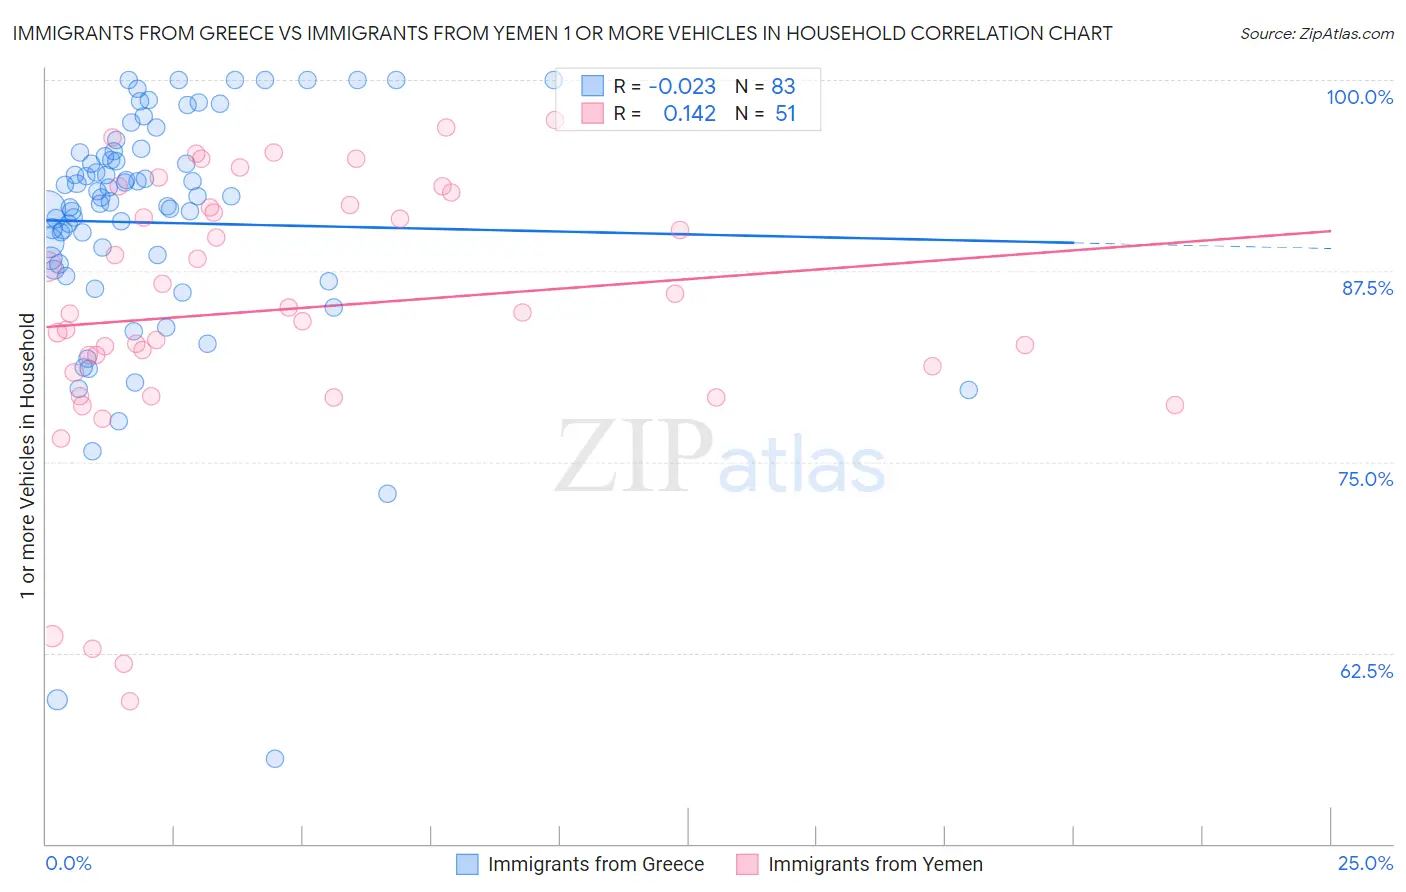
Immigrants from Greece vs Immigrants from Yemen 1 or more Vehicles in Household Correlation Chart
The statistical analysis conducted on geographies consisting of 216,749,502 people shows no correlation between the proportion of Immigrants from Greece and percentage of households with 1 or more vehicles available in the United States with a correlation coefficient (R) of -0.023 and weighted average of 85.4%. Similarly, the statistical analysis conducted on geographies consisting of 82,433,611 people shows a poor positive correlation between the proportion of Immigrants from Yemen and percentage of households with 1 or more vehicles available in the United States with a correlation coefficient (R) of 0.142 and weighted average of 80.5%, a difference of 6.0%.
1 or more Vehicles in Household Correlation Summary
| Measurement | Immigrants from Greece | Immigrants from Yemen |
| Minimum | 55.5% | 59.3% |
| Maximum | 100.0% | 97.4% |
| Range | 44.5% | 38.1% |
| Mean | 90.7% | 85.0% |
| Median | 92.3% | 84.8% |
| Interquartile 25% (IQ1) | 88.0% | 80.8% |
| Interquartile 75% (IQ3) | 95.3% | 91.8% |
| Interquartile Range (IQR) | 7.3% | 11.0% |
| Standard Deviation (Sample) | 8.1% | 9.0% |
| Standard Deviation (Population) | 8.0% | 8.9% |
Demographics Similar to Immigrants from Greece and Immigrants from Yemen by 1 or more Vehicles in Household
In terms of 1 or more vehicles in household, the demographic groups most similar to Immigrants from Greece are Immigrants from Ukraine (85.2%, a difference of 0.17%), Immigrants from China (84.9%, a difference of 0.51%), Immigrants from Western Africa (84.9%, a difference of 0.53%), Tohono O'odham (84.7%, a difference of 0.79%), and Immigrants from Belize (84.7%, a difference of 0.82%). Similarly, the demographic groups most similar to Immigrants from Yemen are Immigrants from Cabo Verde (81.6%, a difference of 1.3%), Jamaican (82.1%, a difference of 2.0%), Soviet Union (82.7%, a difference of 2.7%), Immigrants from Belarus (83.3%, a difference of 3.5%), and Immigrants from Ghana (83.4%, a difference of 3.6%).
| Demographics | Rating | Rank | 1 or more Vehicles in Household |
| Immigrants | Greece | 0.0 /100 | #303 | Tragic 85.4% |
| Immigrants | Ukraine | 0.0 /100 | #304 | Tragic 85.2% |
| Immigrants | China | 0.0 /100 | #305 | Tragic 84.9% |
| Immigrants | Western Africa | 0.0 /100 | #306 | Tragic 84.9% |
| Tohono O'odham | 0.0 /100 | #307 | Tragic 84.7% |
| Immigrants | Belize | 0.0 /100 | #308 | Tragic 84.7% |
| Immigrants | Haiti | 0.0 /100 | #309 | Tragic 84.7% |
| U.S. Virgin Islanders | 0.0 /100 | #310 | Tragic 84.6% |
| Puerto Ricans | 0.0 /100 | #311 | Tragic 84.6% |
| Cape Verdeans | 0.0 /100 | #312 | Tragic 84.5% |
| Immigrants | Israel | 0.0 /100 | #313 | Tragic 84.5% |
| Albanians | 0.0 /100 | #314 | Tragic 84.4% |
| Cypriots | 0.0 /100 | #315 | Tragic 84.4% |
| Alaska Natives | 0.0 /100 | #316 | Tragic 83.8% |
| Ghanaians | 0.0 /100 | #317 | Tragic 83.6% |
| Immigrants | Ghana | 0.0 /100 | #318 | Tragic 83.4% |
| Immigrants | Belarus | 0.0 /100 | #319 | Tragic 83.3% |
| Soviet Union | 0.0 /100 | #320 | Tragic 82.7% |
| Jamaicans | 0.0 /100 | #321 | Tragic 82.1% |
| Immigrants | Cabo Verde | 0.0 /100 | #322 | Tragic 81.6% |
| Immigrants | Yemen | 0.0 /100 | #323 | Tragic 80.5% |