Immigrants from Greece vs Immigrants from Nepal 1 or more Vehicles in Household
COMPARE
Immigrants from Greece
Immigrants from Nepal
1 or more Vehicles in Household
1 or more Vehicles in Household Comparison
Immigrants from Greece
Immigrants from Nepal
85.4%
1 OR MORE VEHICLES IN HOUSEHOLD
0.0/ 100
METRIC RATING
303rd/ 347
METRIC RANK
89.5%
1 OR MORE VEHICLES IN HOUSEHOLD
38.9/ 100
METRIC RATING
188th/ 347
METRIC RANK
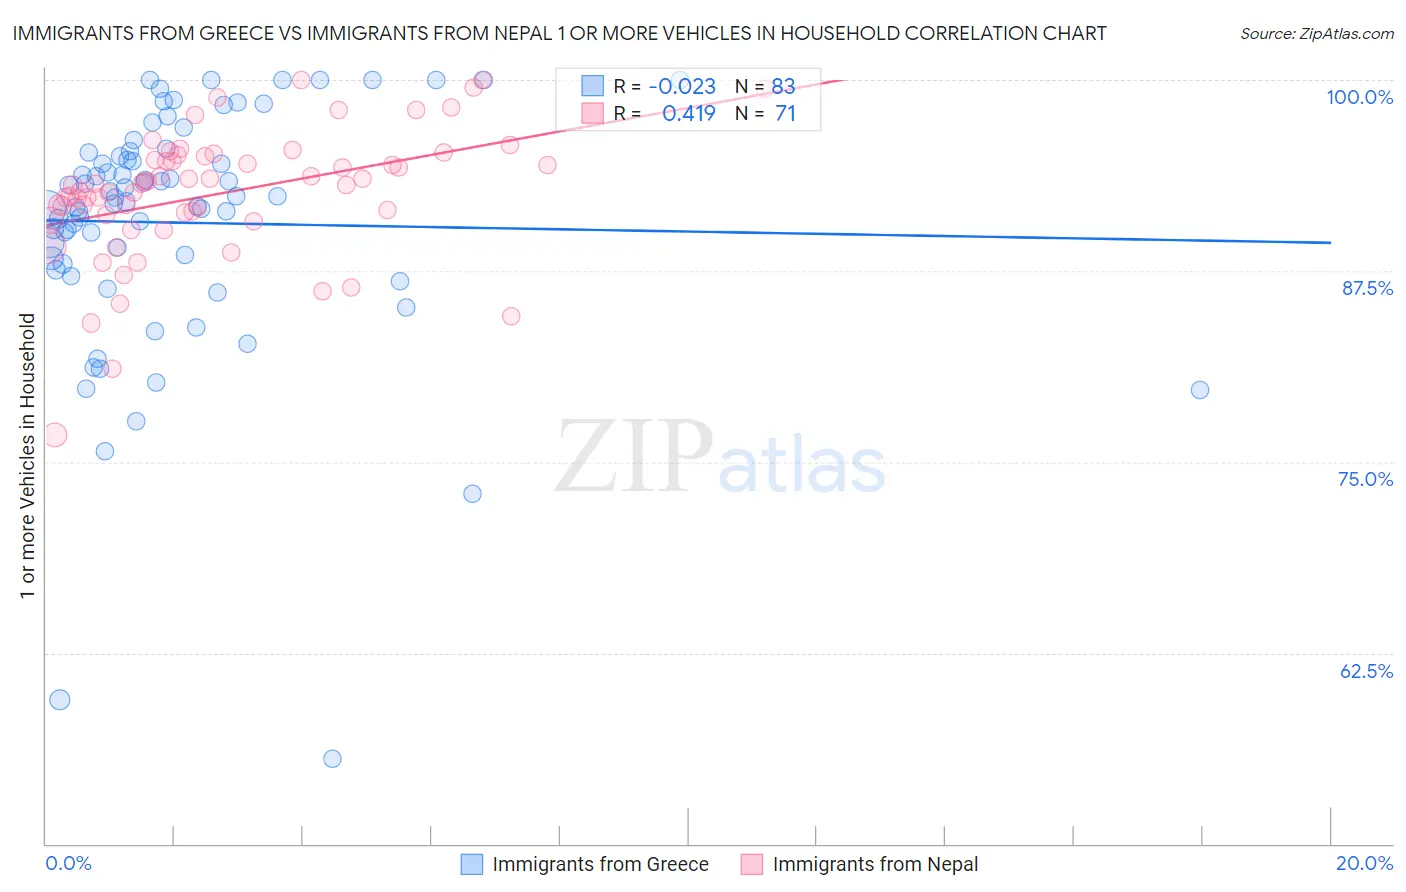
Immigrants from Greece vs Immigrants from Nepal 1 or more Vehicles in Household Correlation Chart
The statistical analysis conducted on geographies consisting of 216,749,502 people shows no correlation between the proportion of Immigrants from Greece and percentage of households with 1 or more vehicles available in the United States with a correlation coefficient (R) of -0.023 and weighted average of 85.4%. Similarly, the statistical analysis conducted on geographies consisting of 186,489,458 people shows a moderate positive correlation between the proportion of Immigrants from Nepal and percentage of households with 1 or more vehicles available in the United States with a correlation coefficient (R) of 0.419 and weighted average of 89.5%, a difference of 4.9%.
1 or more Vehicles in Household Correlation Summary
| Measurement | Immigrants from Greece | Immigrants from Nepal |
| Minimum | 55.5% | 76.8% |
| Maximum | 100.0% | 100.0% |
| Range | 44.5% | 23.2% |
| Mean | 90.7% | 92.6% |
| Median | 92.3% | 93.1% |
| Interquartile 25% (IQ1) | 88.0% | 91.1% |
| Interquartile 75% (IQ3) | 95.3% | 95.0% |
| Interquartile Range (IQR) | 7.3% | 3.9% |
| Standard Deviation (Sample) | 8.1% | 4.2% |
| Standard Deviation (Population) | 8.0% | 4.2% |
Similar Demographics by 1 or more Vehicles in Household
Demographics Similar to Immigrants from Greece by 1 or more Vehicles in Household
In terms of 1 or more vehicles in household, the demographic groups most similar to Immigrants from Greece are Moroccan (85.4%, a difference of 0.030%), Immigrants from Panama (85.4%, a difference of 0.050%), Immigrants from Russia (85.4%, a difference of 0.090%), Yuman (85.5%, a difference of 0.10%), and Immigrants from Ukraine (85.2%, a difference of 0.17%).
| Demographics | Rating | Rank | 1 or more Vehicles in Household |
| Immigrants | Spain | 0.0 /100 | #296 | Tragic 85.8% |
| Paraguayans | 0.0 /100 | #297 | Tragic 85.7% |
| Belizeans | 0.0 /100 | #298 | Tragic 85.7% |
| Yuman | 0.0 /100 | #299 | Tragic 85.5% |
| Immigrants | Russia | 0.0 /100 | #300 | Tragic 85.4% |
| Immigrants | Panama | 0.0 /100 | #301 | Tragic 85.4% |
| Moroccans | 0.0 /100 | #302 | Tragic 85.4% |
| Immigrants | Greece | 0.0 /100 | #303 | Tragic 85.4% |
| Immigrants | Ukraine | 0.0 /100 | #304 | Tragic 85.2% |
| Immigrants | China | 0.0 /100 | #305 | Tragic 84.9% |
| Immigrants | Western Africa | 0.0 /100 | #306 | Tragic 84.9% |
| Tohono O'odham | 0.0 /100 | #307 | Tragic 84.7% |
| Immigrants | Belize | 0.0 /100 | #308 | Tragic 84.7% |
| Immigrants | Haiti | 0.0 /100 | #309 | Tragic 84.7% |
| U.S. Virgin Islanders | 0.0 /100 | #310 | Tragic 84.6% |
Demographics Similar to Immigrants from Nepal by 1 or more Vehicles in Household
In terms of 1 or more vehicles in household, the demographic groups most similar to Immigrants from Nepal are South American (89.5%, a difference of 0.010%), Immigrants from Brazil (89.6%, a difference of 0.020%), Pueblo (89.6%, a difference of 0.020%), Carpatho Rusyn (89.5%, a difference of 0.020%), and Shoshone (89.5%, a difference of 0.020%).
| Demographics | Rating | Rank | 1 or more Vehicles in Household |
| Immigrants | Ethiopia | 42.5 /100 | #181 | Average 89.6% |
| Ukrainians | 42.4 /100 | #182 | Average 89.6% |
| Ethiopians | 41.2 /100 | #183 | Average 89.6% |
| Immigrants | Bulgaria | 40.7 /100 | #184 | Average 89.6% |
| Immigrants | Brazil | 40.1 /100 | #185 | Average 89.6% |
| Pueblo | 39.9 /100 | #186 | Fair 89.6% |
| South Americans | 39.6 /100 | #187 | Fair 89.5% |
| Immigrants | Nepal | 38.9 /100 | #188 | Fair 89.5% |
| Carpatho Rusyns | 37.8 /100 | #189 | Fair 89.5% |
| Shoshone | 37.5 /100 | #190 | Fair 89.5% |
| Immigrants | Poland | 37.1 /100 | #191 | Fair 89.5% |
| Immigrants | North Macedonia | 36.5 /100 | #192 | Fair 89.5% |
| Immigrants | Northern Europe | 35.5 /100 | #193 | Fair 89.5% |
| Immigrants | Eritrea | 33.2 /100 | #194 | Fair 89.4% |
| Immigrants | Armenia | 31.8 /100 | #195 | Fair 89.4% |