Immigrants from Greece vs Native Hawaiian 1 or more Vehicles in Household
COMPARE
Immigrants from Greece
Native Hawaiian
1 or more Vehicles in Household
1 or more Vehicles in Household Comparison
Immigrants from Greece
Native Hawaiians
85.4%
1 OR MORE VEHICLES IN HOUSEHOLD
0.0/ 100
METRIC RATING
303rd/ 347
METRIC RANK
92.4%
1 OR MORE VEHICLES IN HOUSEHOLD
100.0/ 100
METRIC RATING
29th/ 347
METRIC RANK
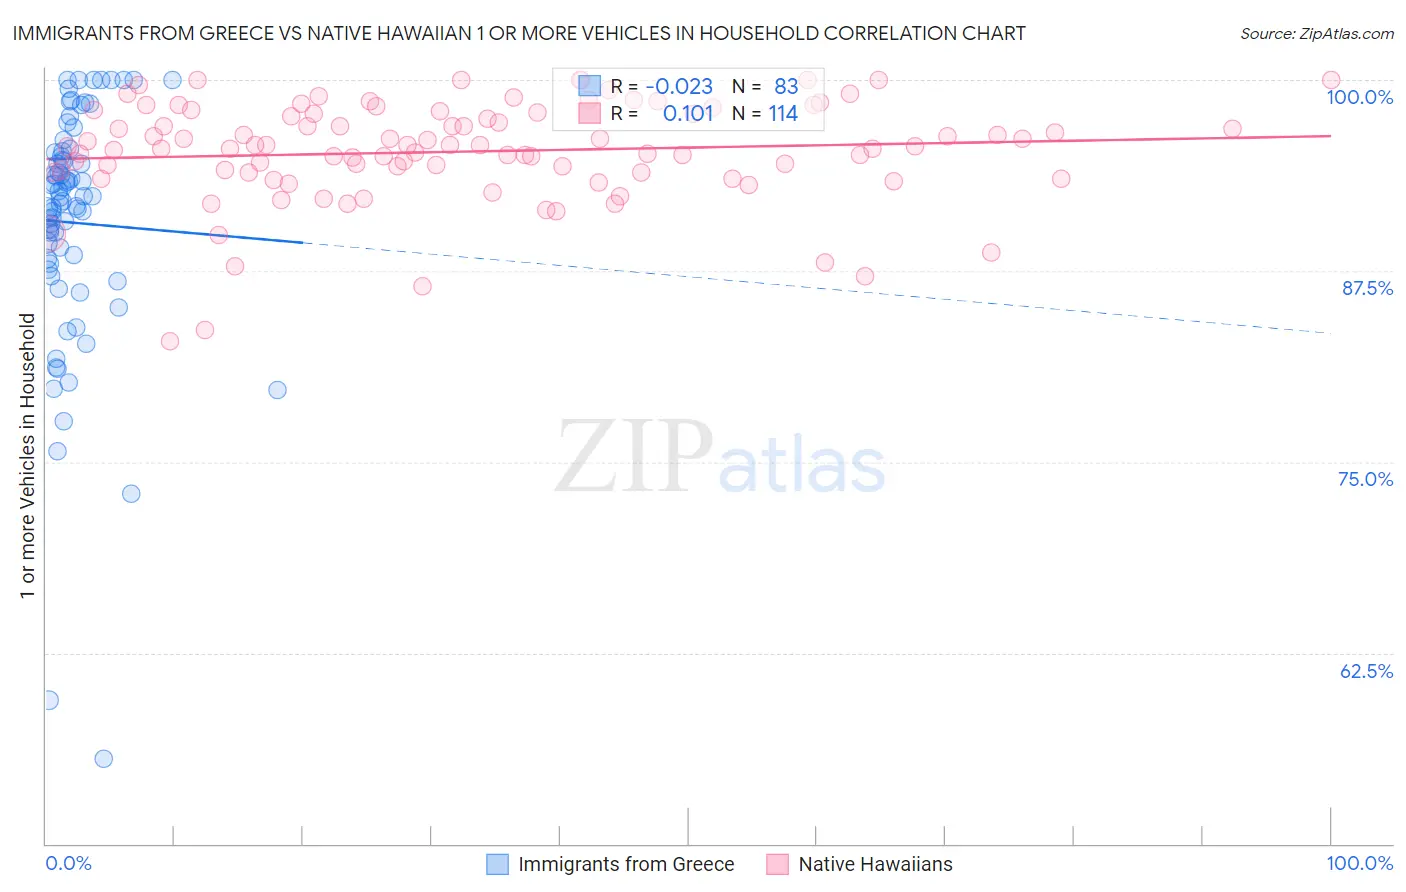
Immigrants from Greece vs Native Hawaiian 1 or more Vehicles in Household Correlation Chart
The statistical analysis conducted on geographies consisting of 216,749,502 people shows no correlation between the proportion of Immigrants from Greece and percentage of households with 1 or more vehicles available in the United States with a correlation coefficient (R) of -0.023 and weighted average of 85.4%. Similarly, the statistical analysis conducted on geographies consisting of 331,859,591 people shows a poor positive correlation between the proportion of Native Hawaiians and percentage of households with 1 or more vehicles available in the United States with a correlation coefficient (R) of 0.101 and weighted average of 92.4%, a difference of 8.3%.
1 or more Vehicles in Household Correlation Summary
| Measurement | Immigrants from Greece | Native Hawaiian |
| Minimum | 55.5% | 82.9% |
| Maximum | 100.0% | 100.0% |
| Range | 44.5% | 17.1% |
| Mean | 90.7% | 95.3% |
| Median | 92.3% | 95.6% |
| Interquartile 25% (IQ1) | 88.0% | 93.9% |
| Interquartile 75% (IQ3) | 95.3% | 97.8% |
| Interquartile Range (IQR) | 7.3% | 3.9% |
| Standard Deviation (Sample) | 8.1% | 3.3% |
| Standard Deviation (Population) | 8.0% | 3.3% |
Similar Demographics by 1 or more Vehicles in Household
Demographics Similar to Immigrants from Greece by 1 or more Vehicles in Household
In terms of 1 or more vehicles in household, the demographic groups most similar to Immigrants from Greece are Moroccan (85.4%, a difference of 0.030%), Immigrants from Panama (85.4%, a difference of 0.050%), Immigrants from Russia (85.4%, a difference of 0.090%), Yuman (85.5%, a difference of 0.10%), and Immigrants from Ukraine (85.2%, a difference of 0.17%).
| Demographics | Rating | Rank | 1 or more Vehicles in Household |
| Immigrants | Spain | 0.0 /100 | #296 | Tragic 85.8% |
| Paraguayans | 0.0 /100 | #297 | Tragic 85.7% |
| Belizeans | 0.0 /100 | #298 | Tragic 85.7% |
| Yuman | 0.0 /100 | #299 | Tragic 85.5% |
| Immigrants | Russia | 0.0 /100 | #300 | Tragic 85.4% |
| Immigrants | Panama | 0.0 /100 | #301 | Tragic 85.4% |
| Moroccans | 0.0 /100 | #302 | Tragic 85.4% |
| Immigrants | Greece | 0.0 /100 | #303 | Tragic 85.4% |
| Immigrants | Ukraine | 0.0 /100 | #304 | Tragic 85.2% |
| Immigrants | China | 0.0 /100 | #305 | Tragic 84.9% |
| Immigrants | Western Africa | 0.0 /100 | #306 | Tragic 84.9% |
| Tohono O'odham | 0.0 /100 | #307 | Tragic 84.7% |
| Immigrants | Belize | 0.0 /100 | #308 | Tragic 84.7% |
| Immigrants | Haiti | 0.0 /100 | #309 | Tragic 84.7% |
| U.S. Virgin Islanders | 0.0 /100 | #310 | Tragic 84.6% |
Demographics Similar to Native Hawaiians by 1 or more Vehicles in Household
In terms of 1 or more vehicles in household, the demographic groups most similar to Native Hawaiians are Finnish (92.4%, a difference of 0.0%), Sri Lankan (92.5%, a difference of 0.010%), Samoan (92.4%, a difference of 0.010%), American (92.5%, a difference of 0.050%), and Basque (92.4%, a difference of 0.050%).
| Demographics | Rating | Rank | 1 or more Vehicles in Household |
| French | 100.0 /100 | #22 | Exceptional 92.7% |
| Nepalese | 100.0 /100 | #23 | Exceptional 92.6% |
| Yaqui | 100.0 /100 | #24 | Exceptional 92.6% |
| Immigrants | Iraq | 100.0 /100 | #25 | Exceptional 92.5% |
| British | 100.0 /100 | #26 | Exceptional 92.5% |
| Americans | 100.0 /100 | #27 | Exceptional 92.5% |
| Sri Lankans | 100.0 /100 | #28 | Exceptional 92.5% |
| Native Hawaiians | 100.0 /100 | #29 | Exceptional 92.4% |
| Finns | 100.0 /100 | #30 | Exceptional 92.4% |
| Samoans | 100.0 /100 | #31 | Exceptional 92.4% |
| Basques | 100.0 /100 | #32 | Exceptional 92.4% |
| Cherokee | 100.0 /100 | #33 | Exceptional 92.4% |
| Italians | 99.9 /100 | #34 | Exceptional 92.3% |
| Czechoslovakians | 99.9 /100 | #35 | Exceptional 92.3% |
| Malaysians | 99.9 /100 | #36 | Exceptional 92.3% |