Immigrants from Greece vs Arab 1 or more Vehicles in Household
COMPARE
Immigrants from Greece
Arab
1 or more Vehicles in Household
1 or more Vehicles in Household Comparison
Immigrants from Greece
Arabs
85.4%
1 OR MORE VEHICLES IN HOUSEHOLD
0.0/ 100
METRIC RATING
303rd/ 347
METRIC RANK
89.6%
1 OR MORE VEHICLES IN HOUSEHOLD
43.3/ 100
METRIC RATING
180th/ 347
METRIC RANK
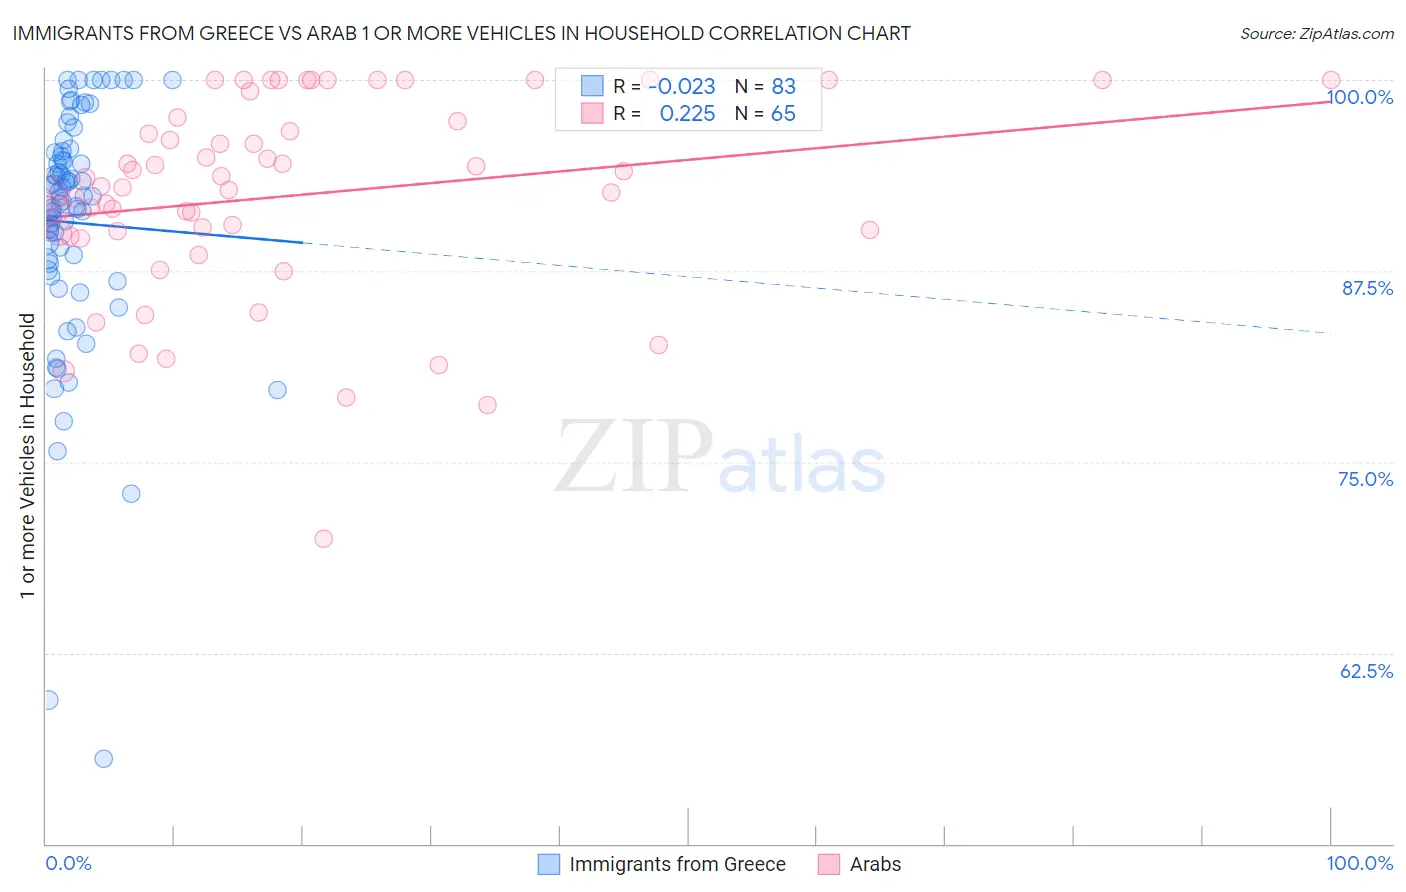
Immigrants from Greece vs Arab 1 or more Vehicles in Household Correlation Chart
The statistical analysis conducted on geographies consisting of 216,749,502 people shows no correlation between the proportion of Immigrants from Greece and percentage of households with 1 or more vehicles available in the United States with a correlation coefficient (R) of -0.023 and weighted average of 85.4%. Similarly, the statistical analysis conducted on geographies consisting of 486,370,240 people shows a weak positive correlation between the proportion of Arabs and percentage of households with 1 or more vehicles available in the United States with a correlation coefficient (R) of 0.225 and weighted average of 89.6%, a difference of 5.0%.
1 or more Vehicles in Household Correlation Summary
| Measurement | Immigrants from Greece | Arab |
| Minimum | 55.5% | 70.0% |
| Maximum | 100.0% | 100.0% |
| Range | 44.5% | 30.0% |
| Mean | 90.7% | 92.4% |
| Median | 92.3% | 93.0% |
| Interquartile 25% (IQ1) | 88.0% | 89.9% |
| Interquartile 75% (IQ3) | 95.3% | 97.4% |
| Interquartile Range (IQR) | 7.3% | 7.5% |
| Standard Deviation (Sample) | 8.1% | 6.5% |
| Standard Deviation (Population) | 8.0% | 6.5% |
Similar Demographics by 1 or more Vehicles in Household
Demographics Similar to Immigrants from Greece by 1 or more Vehicles in Household
In terms of 1 or more vehicles in household, the demographic groups most similar to Immigrants from Greece are Moroccan (85.4%, a difference of 0.030%), Immigrants from Panama (85.4%, a difference of 0.050%), Immigrants from Russia (85.4%, a difference of 0.090%), Yuman (85.5%, a difference of 0.10%), and Immigrants from Ukraine (85.2%, a difference of 0.17%).
| Demographics | Rating | Rank | 1 or more Vehicles in Household |
| Immigrants | Spain | 0.0 /100 | #296 | Tragic 85.8% |
| Paraguayans | 0.0 /100 | #297 | Tragic 85.7% |
| Belizeans | 0.0 /100 | #298 | Tragic 85.7% |
| Yuman | 0.0 /100 | #299 | Tragic 85.5% |
| Immigrants | Russia | 0.0 /100 | #300 | Tragic 85.4% |
| Immigrants | Panama | 0.0 /100 | #301 | Tragic 85.4% |
| Moroccans | 0.0 /100 | #302 | Tragic 85.4% |
| Immigrants | Greece | 0.0 /100 | #303 | Tragic 85.4% |
| Immigrants | Ukraine | 0.0 /100 | #304 | Tragic 85.2% |
| Immigrants | China | 0.0 /100 | #305 | Tragic 84.9% |
| Immigrants | Western Africa | 0.0 /100 | #306 | Tragic 84.9% |
| Tohono O'odham | 0.0 /100 | #307 | Tragic 84.7% |
| Immigrants | Belize | 0.0 /100 | #308 | Tragic 84.7% |
| Immigrants | Haiti | 0.0 /100 | #309 | Tragic 84.7% |
| U.S. Virgin Islanders | 0.0 /100 | #310 | Tragic 84.6% |
Demographics Similar to Arabs by 1 or more Vehicles in Household
In terms of 1 or more vehicles in household, the demographic groups most similar to Arabs are Immigrants from El Salvador (89.6%, a difference of 0.010%), German Russian (89.6%, a difference of 0.010%), Immigrants from Ethiopia (89.6%, a difference of 0.010%), Ukrainian (89.6%, a difference of 0.010%), and Ethiopian (89.6%, a difference of 0.030%).
| Demographics | Rating | Rank | 1 or more Vehicles in Household |
| Lumbee | 52.8 /100 | #173 | Average 89.7% |
| Filipinos | 50.0 /100 | #174 | Average 89.7% |
| Immigrants | Burma/Myanmar | 47.6 /100 | #175 | Average 89.7% |
| Immigrants | Sudan | 47.1 /100 | #176 | Average 89.7% |
| Hmong | 45.8 /100 | #177 | Average 89.6% |
| Immigrants | El Salvador | 44.1 /100 | #178 | Average 89.6% |
| German Russians | 44.0 /100 | #179 | Average 89.6% |
| Arabs | 43.3 /100 | #180 | Average 89.6% |
| Immigrants | Ethiopia | 42.5 /100 | #181 | Average 89.6% |
| Ukrainians | 42.4 /100 | #182 | Average 89.6% |
| Ethiopians | 41.2 /100 | #183 | Average 89.6% |
| Immigrants | Bulgaria | 40.7 /100 | #184 | Average 89.6% |
| Immigrants | Brazil | 40.1 /100 | #185 | Average 89.6% |
| Pueblo | 39.9 /100 | #186 | Fair 89.6% |
| South Americans | 39.6 /100 | #187 | Fair 89.5% |