Immigrants from Greece vs Immigrants from Egypt 1 or more Vehicles in Household
COMPARE
Immigrants from Greece
Immigrants from Egypt
1 or more Vehicles in Household
1 or more Vehicles in Household Comparison
Immigrants from Greece
Immigrants from Egypt
85.4%
1 OR MORE VEHICLES IN HOUSEHOLD
0.0/ 100
METRIC RATING
303rd/ 347
METRIC RANK
87.8%
1 OR MORE VEHICLES IN HOUSEHOLD
0.5/ 100
METRIC RATING
263rd/ 347
METRIC RANK
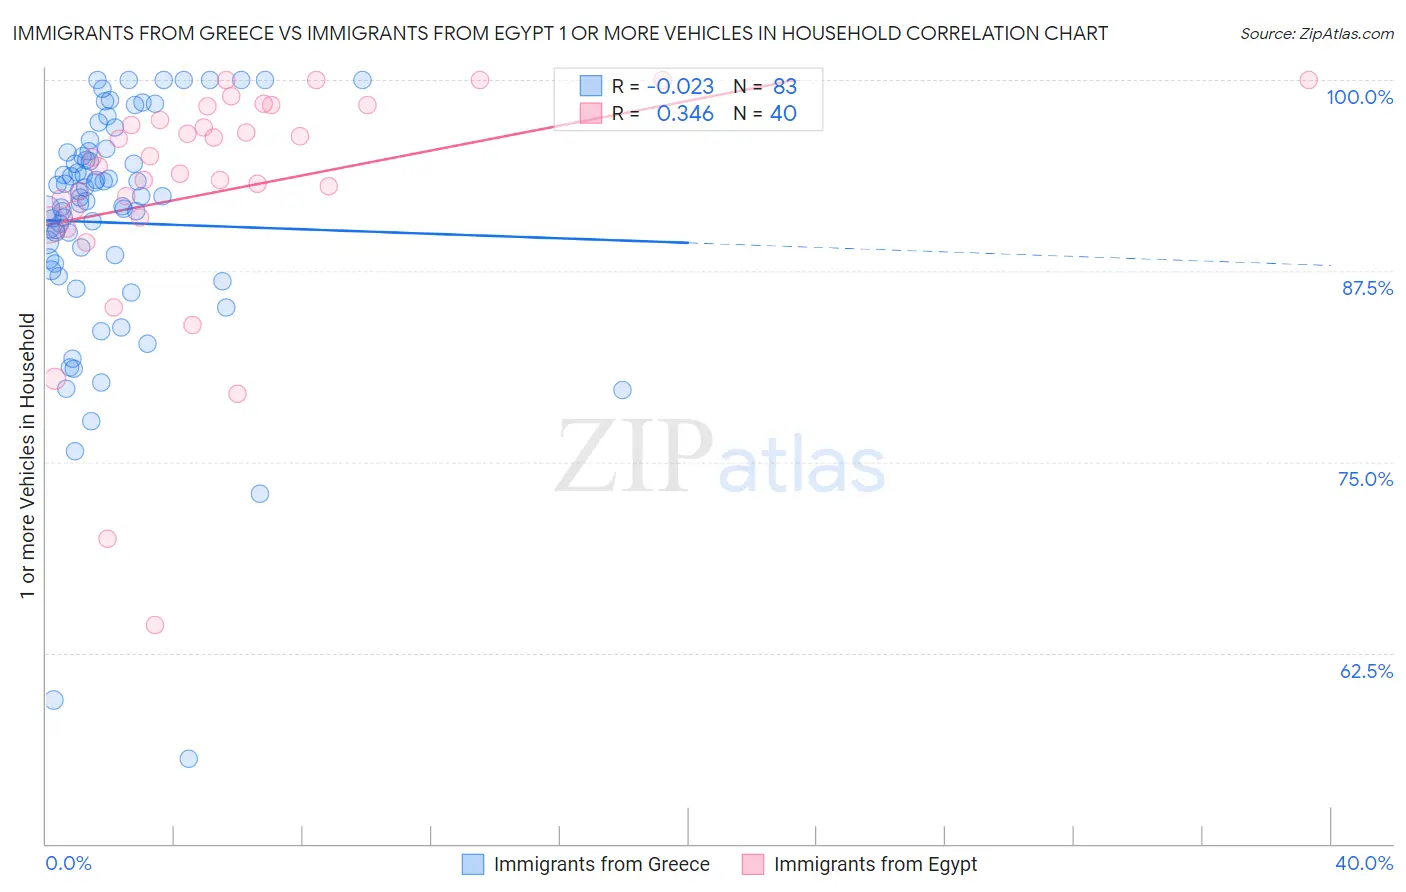
Immigrants from Greece vs Immigrants from Egypt 1 or more Vehicles in Household Correlation Chart
The statistical analysis conducted on geographies consisting of 216,749,502 people shows no correlation between the proportion of Immigrants from Greece and percentage of households with 1 or more vehicles available in the United States with a correlation coefficient (R) of -0.023 and weighted average of 85.4%. Similarly, the statistical analysis conducted on geographies consisting of 245,380,882 people shows a mild positive correlation between the proportion of Immigrants from Egypt and percentage of households with 1 or more vehicles available in the United States with a correlation coefficient (R) of 0.346 and weighted average of 87.8%, a difference of 2.9%.
1 or more Vehicles in Household Correlation Summary
| Measurement | Immigrants from Greece | Immigrants from Egypt |
| Minimum | 55.5% | 64.3% |
| Maximum | 100.0% | 100.0% |
| Range | 44.5% | 35.7% |
| Mean | 90.7% | 92.7% |
| Median | 92.3% | 94.6% |
| Interquartile 25% (IQ1) | 88.0% | 91.3% |
| Interquartile 75% (IQ3) | 95.3% | 97.9% |
| Interquartile Range (IQR) | 7.3% | 6.6% |
| Standard Deviation (Sample) | 8.1% | 7.8% |
| Standard Deviation (Population) | 8.0% | 7.7% |
Similar Demographics by 1 or more Vehicles in Household
Demographics Similar to Immigrants from Greece by 1 or more Vehicles in Household
In terms of 1 or more vehicles in household, the demographic groups most similar to Immigrants from Greece are Moroccan (85.4%, a difference of 0.030%), Immigrants from Panama (85.4%, a difference of 0.050%), Immigrants from Russia (85.4%, a difference of 0.090%), Yuman (85.5%, a difference of 0.10%), and Immigrants from Ukraine (85.2%, a difference of 0.17%).
| Demographics | Rating | Rank | 1 or more Vehicles in Household |
| Immigrants | Spain | 0.0 /100 | #296 | Tragic 85.8% |
| Paraguayans | 0.0 /100 | #297 | Tragic 85.7% |
| Belizeans | 0.0 /100 | #298 | Tragic 85.7% |
| Yuman | 0.0 /100 | #299 | Tragic 85.5% |
| Immigrants | Russia | 0.0 /100 | #300 | Tragic 85.4% |
| Immigrants | Panama | 0.0 /100 | #301 | Tragic 85.4% |
| Moroccans | 0.0 /100 | #302 | Tragic 85.4% |
| Immigrants | Greece | 0.0 /100 | #303 | Tragic 85.4% |
| Immigrants | Ukraine | 0.0 /100 | #304 | Tragic 85.2% |
| Immigrants | China | 0.0 /100 | #305 | Tragic 84.9% |
| Immigrants | Western Africa | 0.0 /100 | #306 | Tragic 84.9% |
| Tohono O'odham | 0.0 /100 | #307 | Tragic 84.7% |
| Immigrants | Belize | 0.0 /100 | #308 | Tragic 84.7% |
| Immigrants | Haiti | 0.0 /100 | #309 | Tragic 84.7% |
| U.S. Virgin Islanders | 0.0 /100 | #310 | Tragic 84.6% |
Demographics Similar to Immigrants from Egypt by 1 or more Vehicles in Household
In terms of 1 or more vehicles in household, the demographic groups most similar to Immigrants from Egypt are Immigrants from Liberia (87.8%, a difference of 0.010%), African (87.8%, a difference of 0.040%), Subsaharan African (87.9%, a difference of 0.070%), Immigrants from Switzerland (87.9%, a difference of 0.10%), and Macedonian (87.9%, a difference of 0.14%).
| Demographics | Rating | Rank | 1 or more Vehicles in Household |
| Colombians | 0.9 /100 | #256 | Tragic 88.0% |
| Liberians | 0.9 /100 | #257 | Tragic 88.0% |
| South American Indians | 0.9 /100 | #258 | Tragic 88.0% |
| Nigerians | 0.8 /100 | #259 | Tragic 88.0% |
| Macedonians | 0.6 /100 | #260 | Tragic 87.9% |
| Immigrants | Switzerland | 0.6 /100 | #261 | Tragic 87.9% |
| Sub-Saharan Africans | 0.5 /100 | #262 | Tragic 87.9% |
| Immigrants | Egypt | 0.5 /100 | #263 | Tragic 87.8% |
| Immigrants | Liberia | 0.4 /100 | #264 | Tragic 87.8% |
| Africans | 0.4 /100 | #265 | Tragic 87.8% |
| Israelis | 0.3 /100 | #266 | Tragic 87.7% |
| Immigrants | Colombia | 0.3 /100 | #267 | Tragic 87.6% |
| Immigrants | Europe | 0.2 /100 | #268 | Tragic 87.6% |
| Immigrants | Africa | 0.2 /100 | #269 | Tragic 87.6% |
| Panamanians | 0.2 /100 | #270 | Tragic 87.5% |