Immigrants from Greece vs Salvadoran 1 or more Vehicles in Household
COMPARE
Immigrants from Greece
Salvadoran
1 or more Vehicles in Household
1 or more Vehicles in Household Comparison
Immigrants from Greece
Salvadorans
85.4%
1 OR MORE VEHICLES IN HOUSEHOLD
0.0/ 100
METRIC RATING
303rd/ 347
METRIC RANK
90.0%
1 OR MORE VEHICLES IN HOUSEHOLD
68.7/ 100
METRIC RATING
161st/ 347
METRIC RANK
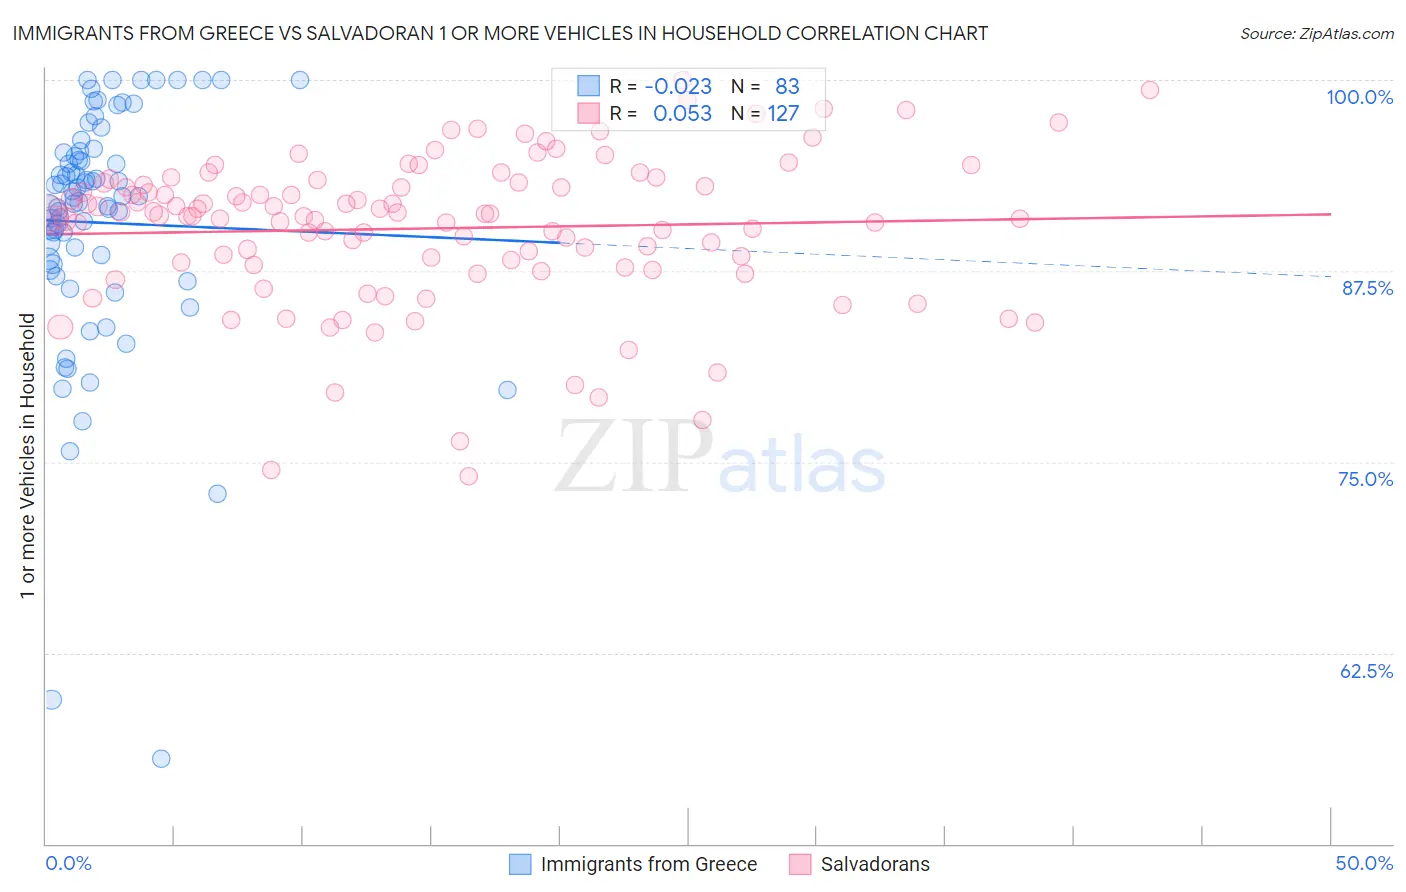
Immigrants from Greece vs Salvadoran 1 or more Vehicles in Household Correlation Chart
The statistical analysis conducted on geographies consisting of 216,749,502 people shows no correlation between the proportion of Immigrants from Greece and percentage of households with 1 or more vehicles available in the United States with a correlation coefficient (R) of -0.023 and weighted average of 85.4%. Similarly, the statistical analysis conducted on geographies consisting of 398,652,231 people shows a slight positive correlation between the proportion of Salvadorans and percentage of households with 1 or more vehicles available in the United States with a correlation coefficient (R) of 0.053 and weighted average of 90.0%, a difference of 5.4%.
1 or more Vehicles in Household Correlation Summary
| Measurement | Immigrants from Greece | Salvadoran |
| Minimum | 55.5% | 74.1% |
| Maximum | 100.0% | 100.0% |
| Range | 44.5% | 25.9% |
| Mean | 90.7% | 90.3% |
| Median | 92.3% | 91.1% |
| Interquartile 25% (IQ1) | 88.0% | 87.9% |
| Interquartile 75% (IQ3) | 95.3% | 93.3% |
| Interquartile Range (IQR) | 7.3% | 5.4% |
| Standard Deviation (Sample) | 8.1% | 4.9% |
| Standard Deviation (Population) | 8.0% | 4.9% |
Similar Demographics by 1 or more Vehicles in Household
Demographics Similar to Immigrants from Greece by 1 or more Vehicles in Household
In terms of 1 or more vehicles in household, the demographic groups most similar to Immigrants from Greece are Moroccan (85.4%, a difference of 0.030%), Immigrants from Panama (85.4%, a difference of 0.050%), Immigrants from Russia (85.4%, a difference of 0.090%), Yuman (85.5%, a difference of 0.10%), and Immigrants from Ukraine (85.2%, a difference of 0.17%).
| Demographics | Rating | Rank | 1 or more Vehicles in Household |
| Immigrants | Spain | 0.0 /100 | #296 | Tragic 85.8% |
| Paraguayans | 0.0 /100 | #297 | Tragic 85.7% |
| Belizeans | 0.0 /100 | #298 | Tragic 85.7% |
| Yuman | 0.0 /100 | #299 | Tragic 85.5% |
| Immigrants | Russia | 0.0 /100 | #300 | Tragic 85.4% |
| Immigrants | Panama | 0.0 /100 | #301 | Tragic 85.4% |
| Moroccans | 0.0 /100 | #302 | Tragic 85.4% |
| Immigrants | Greece | 0.0 /100 | #303 | Tragic 85.4% |
| Immigrants | Ukraine | 0.0 /100 | #304 | Tragic 85.2% |
| Immigrants | China | 0.0 /100 | #305 | Tragic 84.9% |
| Immigrants | Western Africa | 0.0 /100 | #306 | Tragic 84.9% |
| Tohono O'odham | 0.0 /100 | #307 | Tragic 84.7% |
| Immigrants | Belize | 0.0 /100 | #308 | Tragic 84.7% |
| Immigrants | Haiti | 0.0 /100 | #309 | Tragic 84.7% |
| U.S. Virgin Islanders | 0.0 /100 | #310 | Tragic 84.6% |
Demographics Similar to Salvadorans by 1 or more Vehicles in Household
In terms of 1 or more vehicles in household, the demographic groups most similar to Salvadorans are Immigrants from Indonesia (90.0%, a difference of 0.0%), South African (90.0%, a difference of 0.020%), Spanish American Indian (89.9%, a difference of 0.030%), Brazilian (90.0%, a difference of 0.040%), and Immigrants from Congo (90.0%, a difference of 0.050%).
| Demographics | Rating | Rank | 1 or more Vehicles in Household |
| Immigrants | Uganda | 73.8 /100 | #154 | Good 90.1% |
| Immigrants | Immigrants | 73.6 /100 | #155 | Good 90.1% |
| Australians | 72.4 /100 | #156 | Good 90.0% |
| Immigrants | Congo | 71.2 /100 | #157 | Good 90.0% |
| Brazilians | 71.0 /100 | #158 | Good 90.0% |
| South Africans | 69.7 /100 | #159 | Good 90.0% |
| Immigrants | Indonesia | 68.8 /100 | #160 | Good 90.0% |
| Salvadorans | 68.7 /100 | #161 | Good 90.0% |
| Spanish American Indians | 67.0 /100 | #162 | Good 89.9% |
| Immigrants | Austria | 65.5 /100 | #163 | Good 89.9% |
| Comanche | 63.4 /100 | #164 | Good 89.9% |
| Immigrants | Saudi Arabia | 62.6 /100 | #165 | Good 89.9% |
| Immigrants | Middle Africa | 62.2 /100 | #166 | Good 89.9% |
| Immigrants | Latin America | 60.3 /100 | #167 | Good 89.8% |
| Immigrants | Cambodia | 60.1 /100 | #168 | Good 89.8% |