Immigrants from Greece vs Sierra Leonean 1 or more Vehicles in Household
COMPARE
Immigrants from Greece
Sierra Leonean
1 or more Vehicles in Household
1 or more Vehicles in Household Comparison
Immigrants from Greece
Sierra Leoneans
85.4%
1 OR MORE VEHICLES IN HOUSEHOLD
0.0/ 100
METRIC RATING
303rd/ 347
METRIC RANK
89.0%
1 OR MORE VEHICLES IN HOUSEHOLD
13.0/ 100
METRIC RATING
211th/ 347
METRIC RANK
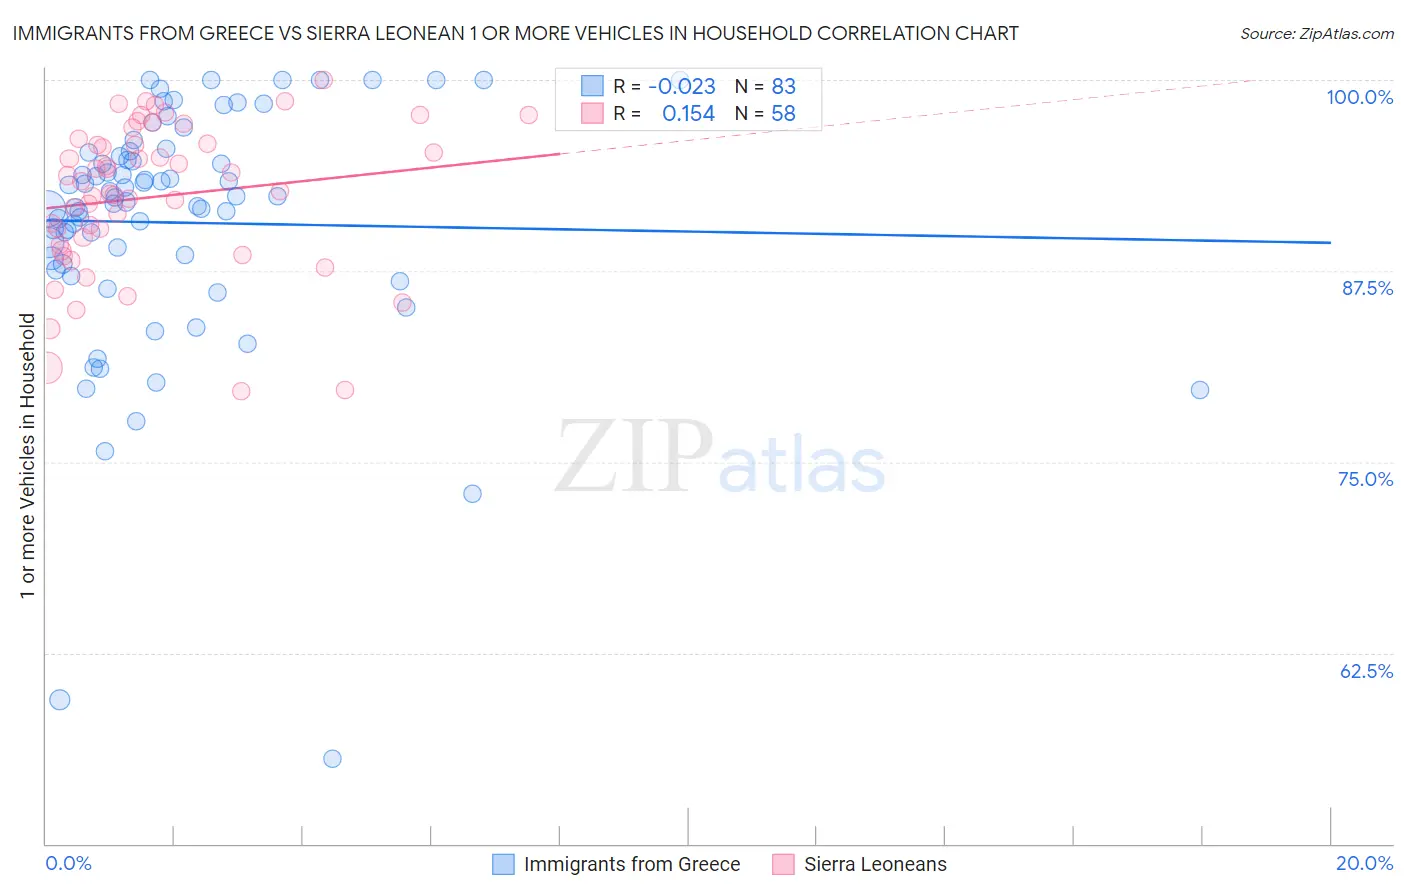
Immigrants from Greece vs Sierra Leonean 1 or more Vehicles in Household Correlation Chart
The statistical analysis conducted on geographies consisting of 216,749,502 people shows no correlation between the proportion of Immigrants from Greece and percentage of households with 1 or more vehicles available in the United States with a correlation coefficient (R) of -0.023 and weighted average of 85.4%. Similarly, the statistical analysis conducted on geographies consisting of 83,323,468 people shows a poor positive correlation between the proportion of Sierra Leoneans and percentage of households with 1 or more vehicles available in the United States with a correlation coefficient (R) of 0.154 and weighted average of 89.0%, a difference of 4.3%.
1 or more Vehicles in Household Correlation Summary
| Measurement | Immigrants from Greece | Sierra Leonean |
| Minimum | 55.5% | 79.6% |
| Maximum | 100.0% | 100.0% |
| Range | 44.5% | 20.4% |
| Mean | 90.7% | 92.4% |
| Median | 92.3% | 93.0% |
| Interquartile 25% (IQ1) | 88.0% | 89.2% |
| Interquartile 75% (IQ3) | 95.3% | 95.8% |
| Interquartile Range (IQR) | 7.3% | 6.6% |
| Standard Deviation (Sample) | 8.1% | 4.9% |
| Standard Deviation (Population) | 8.0% | 4.9% |
Similar Demographics by 1 or more Vehicles in Household
Demographics Similar to Immigrants from Greece by 1 or more Vehicles in Household
In terms of 1 or more vehicles in household, the demographic groups most similar to Immigrants from Greece are Moroccan (85.4%, a difference of 0.030%), Immigrants from Panama (85.4%, a difference of 0.050%), Immigrants from Russia (85.4%, a difference of 0.090%), Yuman (85.5%, a difference of 0.10%), and Immigrants from Ukraine (85.2%, a difference of 0.17%).
| Demographics | Rating | Rank | 1 or more Vehicles in Household |
| Immigrants | Spain | 0.0 /100 | #296 | Tragic 85.8% |
| Paraguayans | 0.0 /100 | #297 | Tragic 85.7% |
| Belizeans | 0.0 /100 | #298 | Tragic 85.7% |
| Yuman | 0.0 /100 | #299 | Tragic 85.5% |
| Immigrants | Russia | 0.0 /100 | #300 | Tragic 85.4% |
| Immigrants | Panama | 0.0 /100 | #301 | Tragic 85.4% |
| Moroccans | 0.0 /100 | #302 | Tragic 85.4% |
| Immigrants | Greece | 0.0 /100 | #303 | Tragic 85.4% |
| Immigrants | Ukraine | 0.0 /100 | #304 | Tragic 85.2% |
| Immigrants | China | 0.0 /100 | #305 | Tragic 84.9% |
| Immigrants | Western Africa | 0.0 /100 | #306 | Tragic 84.9% |
| Tohono O'odham | 0.0 /100 | #307 | Tragic 84.7% |
| Immigrants | Belize | 0.0 /100 | #308 | Tragic 84.7% |
| Immigrants | Haiti | 0.0 /100 | #309 | Tragic 84.7% |
| U.S. Virgin Islanders | 0.0 /100 | #310 | Tragic 84.6% |
Demographics Similar to Sierra Leoneans by 1 or more Vehicles in Household
In terms of 1 or more vehicles in household, the demographic groups most similar to Sierra Leoneans are Somali (89.0%, a difference of 0.010%), Dutch West Indian (89.0%, a difference of 0.020%), Immigrants from Italy (89.1%, a difference of 0.030%), Immigrants from Western Asia (89.0%, a difference of 0.030%), and Immigrants from Hungary (89.0%, a difference of 0.040%).
| Demographics | Rating | Rank | 1 or more Vehicles in Household |
| Romanians | 18.2 /100 | #204 | Poor 89.2% |
| Guatemalans | 17.8 /100 | #205 | Poor 89.2% |
| Apache | 16.2 /100 | #206 | Poor 89.1% |
| Immigrants | Denmark | 14.8 /100 | #207 | Poor 89.1% |
| Immigrants | Chile | 14.4 /100 | #208 | Poor 89.1% |
| Immigrants | Italy | 14.0 /100 | #209 | Poor 89.1% |
| Dutch West Indians | 13.5 /100 | #210 | Poor 89.0% |
| Sierra Leoneans | 13.0 /100 | #211 | Poor 89.0% |
| Somalis | 12.8 /100 | #212 | Poor 89.0% |
| Immigrants | Western Asia | 12.3 /100 | #213 | Poor 89.0% |
| Immigrants | Hungary | 11.9 /100 | #214 | Poor 89.0% |
| Immigrants | Sri Lanka | 10.2 /100 | #215 | Poor 88.9% |
| Immigrants | Argentina | 9.4 /100 | #216 | Tragic 88.9% |
| Argentineans | 8.8 /100 | #217 | Tragic 88.9% |
| Ugandans | 8.7 /100 | #218 | Tragic 88.9% |