Immigrants from Greece vs Aleut In Labor Force | Age 20-24
COMPARE
Immigrants from Greece
Aleut
In Labor Force | Age 20-24
In Labor Force | Age 20-24 Comparison
Immigrants from Greece
Aleuts
74.2%
IN LABOR FORCE | AGE 20-24
4.1/ 100
METRIC RATING
231st/ 347
METRIC RANK
79.0%
IN LABOR FORCE | AGE 20-24
100.0/ 100
METRIC RATING
5th/ 347
METRIC RANK
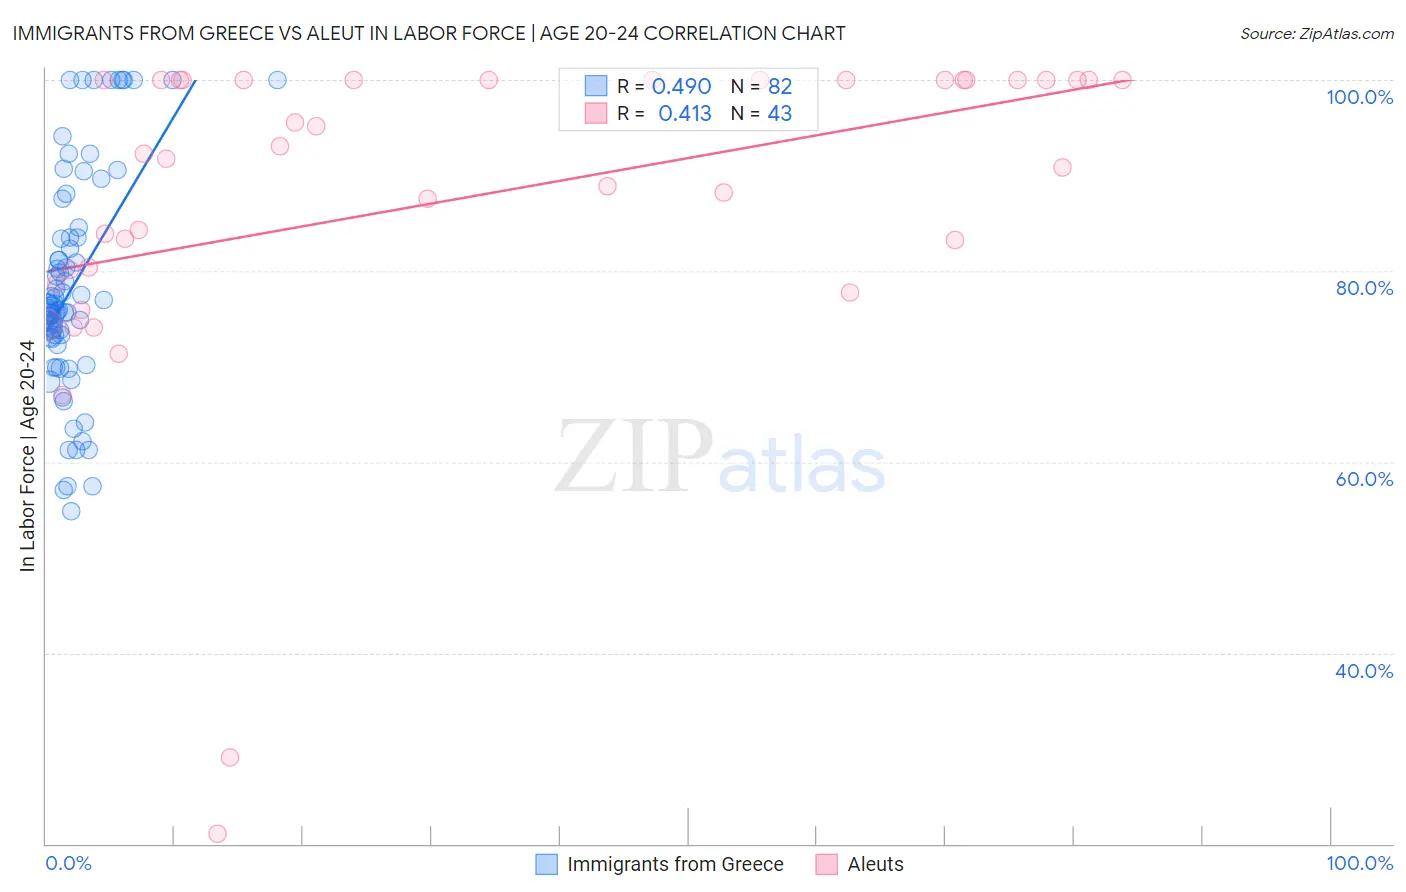
Immigrants from Greece vs Aleut In Labor Force | Age 20-24 Correlation Chart
The statistical analysis conducted on geographies consisting of 216,782,866 people shows a moderate positive correlation between the proportion of Immigrants from Greece and labor force participation rate among population between the ages 20 and 24 in the United States with a correlation coefficient (R) of 0.490 and weighted average of 74.2%. Similarly, the statistical analysis conducted on geographies consisting of 61,769,180 people shows a moderate positive correlation between the proportion of Aleuts and labor force participation rate among population between the ages 20 and 24 in the United States with a correlation coefficient (R) of 0.413 and weighted average of 79.0%, a difference of 6.5%.
In Labor Force | Age 20-24 Correlation Summary
| Measurement | Immigrants from Greece | Aleut |
| Minimum | 54.8% | 21.1% |
| Maximum | 100.0% | 100.0% |
| Range | 45.2% | 78.9% |
| Mean | 78.4% | 87.5% |
| Median | 76.1% | 92.3% |
| Interquartile 25% (IQ1) | 72.9% | 80.1% |
| Interquartile 75% (IQ3) | 83.5% | 100.0% |
| Interquartile Range (IQR) | 10.6% | 19.9% |
| Standard Deviation (Sample) | 11.6% | 17.3% |
| Standard Deviation (Population) | 11.5% | 17.1% |
Similar Demographics by In Labor Force | Age 20-24
Demographics Similar to Immigrants from Greece by In Labor Force | Age 20-24
In terms of in labor force | age 20-24, the demographic groups most similar to Immigrants from Greece are Immigrants from Switzerland (74.2%, a difference of 0.010%), Immigrants from Albania (74.2%, a difference of 0.020%), Immigrants from Sweden (74.2%, a difference of 0.040%), Immigrants from Chile (74.1%, a difference of 0.050%), and Immigrants (74.1%, a difference of 0.060%).
| Demographics | Rating | Rank | In Labor Force | Age 20-24 |
| Seminole | 6.9 /100 | #224 | Tragic 74.3% |
| Ghanaians | 6.2 /100 | #225 | Tragic 74.3% |
| Immigrants | Fiji | 5.9 /100 | #226 | Tragic 74.3% |
| Immigrants | Ireland | 5.8 /100 | #227 | Tragic 74.3% |
| Immigrants | Ukraine | 5.1 /100 | #228 | Tragic 74.2% |
| Immigrants | Sweden | 4.6 /100 | #229 | Tragic 74.2% |
| Immigrants | Albania | 4.3 /100 | #230 | Tragic 74.2% |
| Immigrants | Greece | 4.1 /100 | #231 | Tragic 74.2% |
| Immigrants | Switzerland | 4.1 /100 | #232 | Tragic 74.2% |
| Immigrants | Chile | 3.7 /100 | #233 | Tragic 74.1% |
| Immigrants | Immigrants | 3.6 /100 | #234 | Tragic 74.1% |
| Laotians | 3.5 /100 | #235 | Tragic 74.1% |
| Immigrants | France | 3.3 /100 | #236 | Tragic 74.1% |
| Bermudans | 3.2 /100 | #237 | Tragic 74.1% |
| Immigrants | Japan | 3.0 /100 | #238 | Tragic 74.1% |
Demographics Similar to Aleuts by In Labor Force | Age 20-24
In terms of in labor force | age 20-24, the demographic groups most similar to Aleuts are Danish (79.0%, a difference of 0.010%), Luxembourger (79.0%, a difference of 0.050%), Alaskan Athabascan (79.1%, a difference of 0.14%), Immigrants from Cabo Verde (78.9%, a difference of 0.16%), and Swedish (78.8%, a difference of 0.22%).
| Demographics | Rating | Rank | In Labor Force | Age 20-24 |
| Norwegians | 100.0 /100 | #1 | Exceptional 80.1% |
| Immigrants | Somalia | 100.0 /100 | #2 | Exceptional 79.5% |
| Somalis | 100.0 /100 | #3 | Exceptional 79.3% |
| Alaskan Athabascans | 100.0 /100 | #4 | Exceptional 79.1% |
| Aleuts | 100.0 /100 | #5 | Exceptional 79.0% |
| Danes | 100.0 /100 | #6 | Exceptional 79.0% |
| Luxembourgers | 100.0 /100 | #7 | Exceptional 79.0% |
| Immigrants | Cabo Verde | 100.0 /100 | #8 | Exceptional 78.9% |
| Swedes | 100.0 /100 | #9 | Exceptional 78.8% |
| Slovenes | 100.0 /100 | #10 | Exceptional 78.7% |
| Finns | 100.0 /100 | #11 | Exceptional 78.7% |
| Germans | 100.0 /100 | #12 | Exceptional 78.6% |
| Scandinavians | 100.0 /100 | #13 | Exceptional 78.5% |
| Czechs | 100.0 /100 | #14 | Exceptional 78.5% |
| Sudanese | 100.0 /100 | #15 | Exceptional 78.4% |