Zip Codes with the Highest Percentage of Population Employed in Sales & Related in Sherman, TX
RELATED REPORTS & OPTIONS
Sales & Related
Sherman
Compare Zip Codes
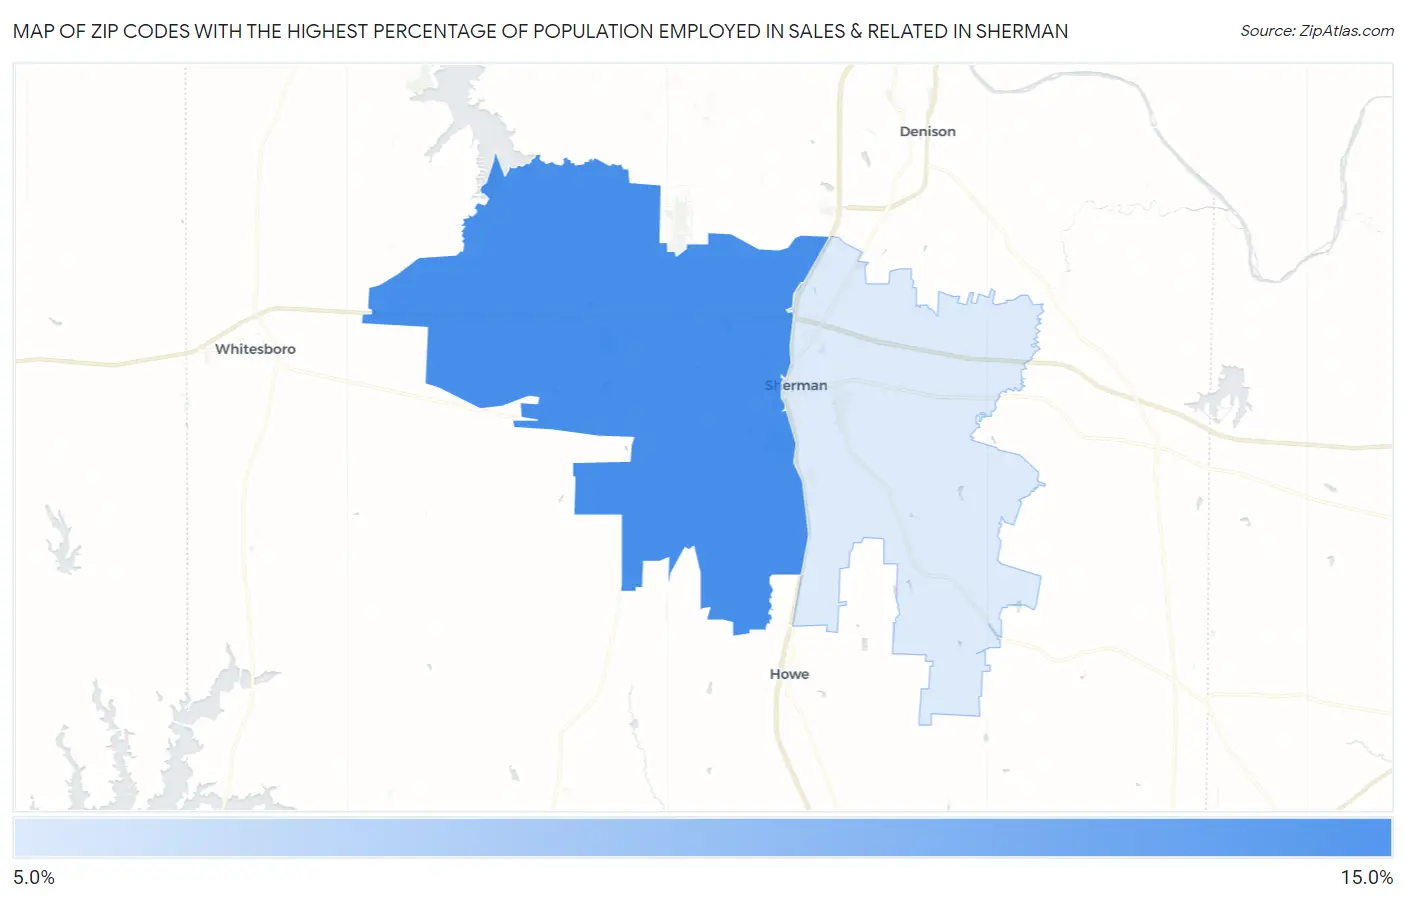
Map of Zip Codes with the Highest Percentage of Population Employed in Sales & Related in Sherman
10.2%
14.5%
Zip Codes with the Highest Percentage of Population Employed in Sales & Related in Sherman, TX
| Zip Code | % Employed | vs State | vs National | |
| 1. | 75092 | 14.5% | 10.2%(+4.26)#184 | 9.6%(+4.89)#3,094 |
| 2. | 75090 | 10.2% | 10.2%(-0.013)#745 | 9.6%(+0.616)#10,388 |
1
Common Questions
What are the Top Zip Codes with the Highest Percentage of Population Employed in Sales & Related in Sherman, TX?
Top Zip Codes with the Highest Percentage of Population Employed in Sales & Related in Sherman, TX are:
What zip code has the Highest Percentage of Population Employed in Sales & Related in Sherman, TX?
75092 has the Highest Percentage of Population Employed in Sales & Related in Sherman, TX with 14.5%.
What is the Percentage of Population Employed in Sales & Related in Sherman, TX?
Percentage of Population Employed in Sales & Related in Sherman is 13.2%.
What is the Percentage of Population Employed in Sales & Related in Texas?
Percentage of Population Employed in Sales & Related in Texas is 10.2%.
What is the Percentage of Population Employed in Sales & Related in the United States?
Percentage of Population Employed in Sales & Related in the United States is 9.6%.