Scandinavian vs Fijian Child Poverty Under the Age of 5
COMPARE
Scandinavian
Fijian
Child Poverty Under the Age of 5
Child Poverty Under the Age of 5 Comparison
Scandinavians
Fijians
15.7%
CHILD POVERTY UNDER THE AGE OF 5
97.1/ 100
METRIC RATING
92nd/ 347
METRIC RANK
19.9%
CHILD POVERTY UNDER THE AGE OF 5
0.3/ 100
METRIC RATING
254th/ 347
METRIC RANK
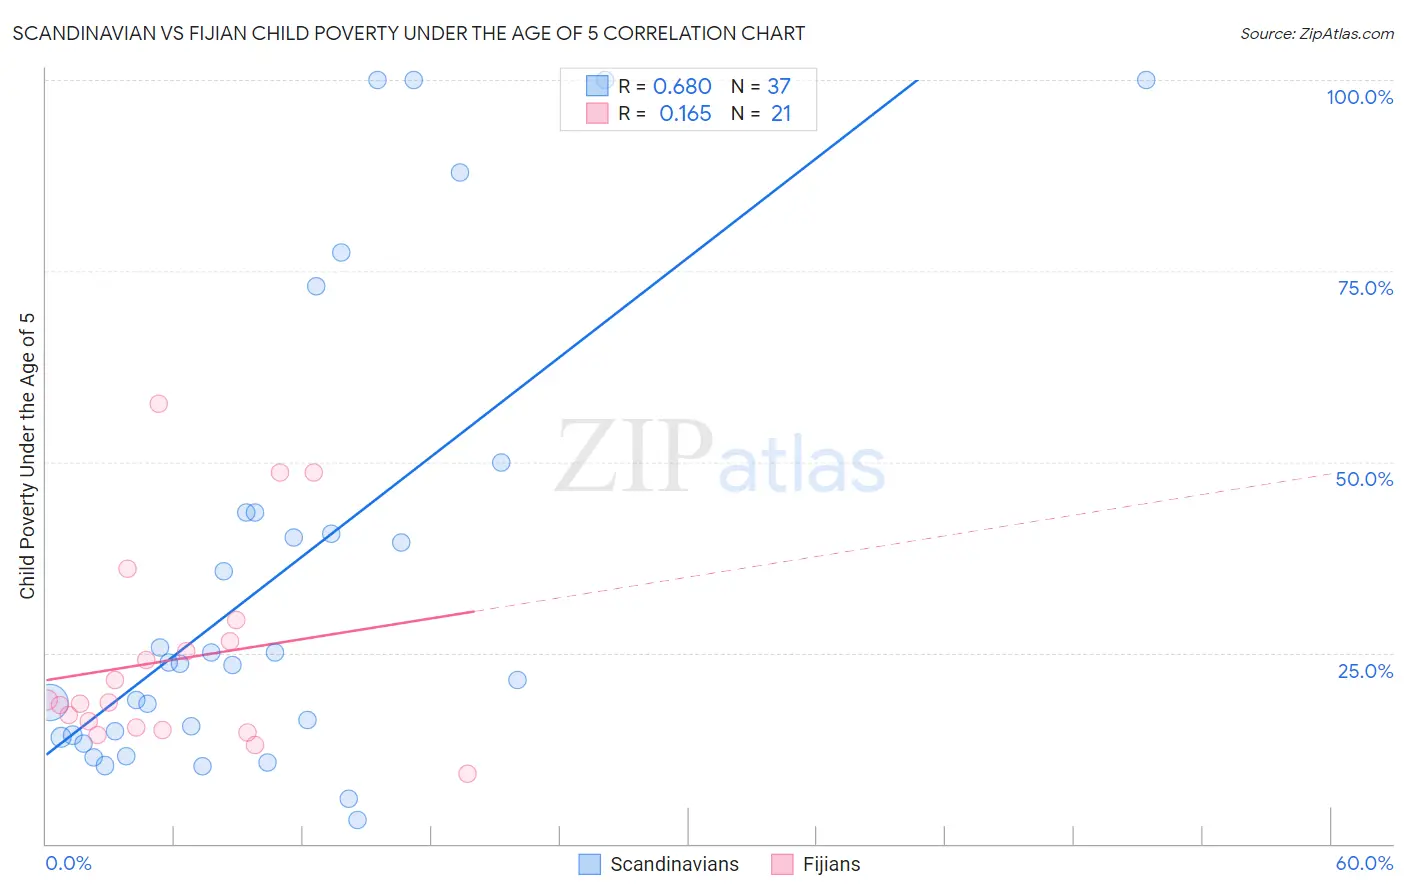
Scandinavian vs Fijian Child Poverty Under the Age of 5 Correlation Chart
The statistical analysis conducted on geographies consisting of 447,069,136 people shows a significant positive correlation between the proportion of Scandinavians and poverty level among children under the age of 5 in the United States with a correlation coefficient (R) of 0.680 and weighted average of 15.7%. Similarly, the statistical analysis conducted on geographies consisting of 55,648,534 people shows a poor positive correlation between the proportion of Fijians and poverty level among children under the age of 5 in the United States with a correlation coefficient (R) of 0.165 and weighted average of 19.9%, a difference of 27.1%.
Child Poverty Under the Age of 5 Correlation Summary
| Measurement | Scandinavian | Fijian |
| Minimum | 3.2% | 9.1% |
| Maximum | 100.0% | 57.7% |
| Range | 96.8% | 48.6% |
| Mean | 35.3% | 24.1% |
| Median | 23.5% | 18.5% |
| Interquartile 25% (IQ1) | 14.0% | 15.1% |
| Interquartile 75% (IQ3) | 43.4% | 27.9% |
| Interquartile Range (IQR) | 29.4% | 12.8% |
| Standard Deviation (Sample) | 30.0% | 13.1% |
| Standard Deviation (Population) | 29.6% | 12.8% |
Similar Demographics by Child Poverty Under the Age of 5
Demographics Similar to Scandinavians by Child Poverty Under the Age of 5
In terms of child poverty under the age of 5, the demographic groups most similar to Scandinavians are Ukrainian (15.7%, a difference of 0.020%), Immigrants from South Eastern Asia (15.7%, a difference of 0.040%), Polish (15.7%, a difference of 0.060%), Immigrants from France (15.6%, a difference of 0.17%), and Immigrants from Croatia (15.6%, a difference of 0.18%).
| Demographics | Rating | Rank | Child Poverty Under the Age of 5 |
| Immigrants | Latvia | 97.4 /100 | #85 | Exceptional 15.6% |
| Immigrants | Malaysia | 97.4 /100 | #86 | Exceptional 15.6% |
| Immigrants | Vietnam | 97.4 /100 | #87 | Exceptional 15.6% |
| Jordanians | 97.3 /100 | #88 | Exceptional 15.6% |
| Immigrants | Croatia | 97.3 /100 | #89 | Exceptional 15.6% |
| Immigrants | France | 97.3 /100 | #90 | Exceptional 15.6% |
| Poles | 97.2 /100 | #91 | Exceptional 15.7% |
| Scandinavians | 97.1 /100 | #92 | Exceptional 15.7% |
| Ukrainians | 97.1 /100 | #93 | Exceptional 15.7% |
| Immigrants | South Eastern Asia | 97.1 /100 | #94 | Exceptional 15.7% |
| Immigrants | Switzerland | 96.4 /100 | #95 | Exceptional 15.8% |
| Immigrants | Kazakhstan | 96.2 /100 | #96 | Exceptional 15.8% |
| Macedonians | 96.2 /100 | #97 | Exceptional 15.8% |
| Immigrants | South Africa | 96.1 /100 | #98 | Exceptional 15.8% |
| Palestinians | 95.9 /100 | #99 | Exceptional 15.8% |
Demographics Similar to Fijians by Child Poverty Under the Age of 5
In terms of child poverty under the age of 5, the demographic groups most similar to Fijians are Immigrants from Cuba (19.9%, a difference of 0.10%), Mexican American Indian (19.9%, a difference of 0.15%), Immigrants from Barbados (20.0%, a difference of 0.32%), Shoshone (20.0%, a difference of 0.33%), and Immigrants from St. Vincent and the Grenadines (20.0%, a difference of 0.47%).
| Demographics | Rating | Rank | Child Poverty Under the Age of 5 |
| Guyanese | 0.4 /100 | #247 | Tragic 19.7% |
| Marshallese | 0.4 /100 | #248 | Tragic 19.7% |
| Immigrants | Middle Africa | 0.4 /100 | #249 | Tragic 19.7% |
| Immigrants | Nonimmigrants | 0.4 /100 | #250 | Tragic 19.7% |
| Pennsylvania Germans | 0.3 /100 | #251 | Tragic 19.8% |
| Immigrants | Nicaragua | 0.3 /100 | #252 | Tragic 19.8% |
| Mexican American Indians | 0.3 /100 | #253 | Tragic 19.9% |
| Fijians | 0.3 /100 | #254 | Tragic 19.9% |
| Immigrants | Cuba | 0.2 /100 | #255 | Tragic 19.9% |
| Immigrants | Barbados | 0.2 /100 | #256 | Tragic 20.0% |
| Shoshone | 0.2 /100 | #257 | Tragic 20.0% |
| Immigrants | St. Vincent and the Grenadines | 0.2 /100 | #258 | Tragic 20.0% |
| Immigrants | El Salvador | 0.2 /100 | #259 | Tragic 20.0% |
| Spanish Americans | 0.2 /100 | #260 | Tragic 20.1% |
| Immigrants | Bangladesh | 0.2 /100 | #261 | Tragic 20.1% |