Scandinavian vs Senegalese Child Poverty Under the Age of 5
COMPARE
Scandinavian
Senegalese
Child Poverty Under the Age of 5
Child Poverty Under the Age of 5 Comparison
Scandinavians
Senegalese
15.7%
CHILD POVERTY UNDER THE AGE OF 5
97.1/ 100
METRIC RATING
92nd/ 347
METRIC RANK
20.9%
CHILD POVERTY UNDER THE AGE OF 5
0.0/ 100
METRIC RATING
281st/ 347
METRIC RANK
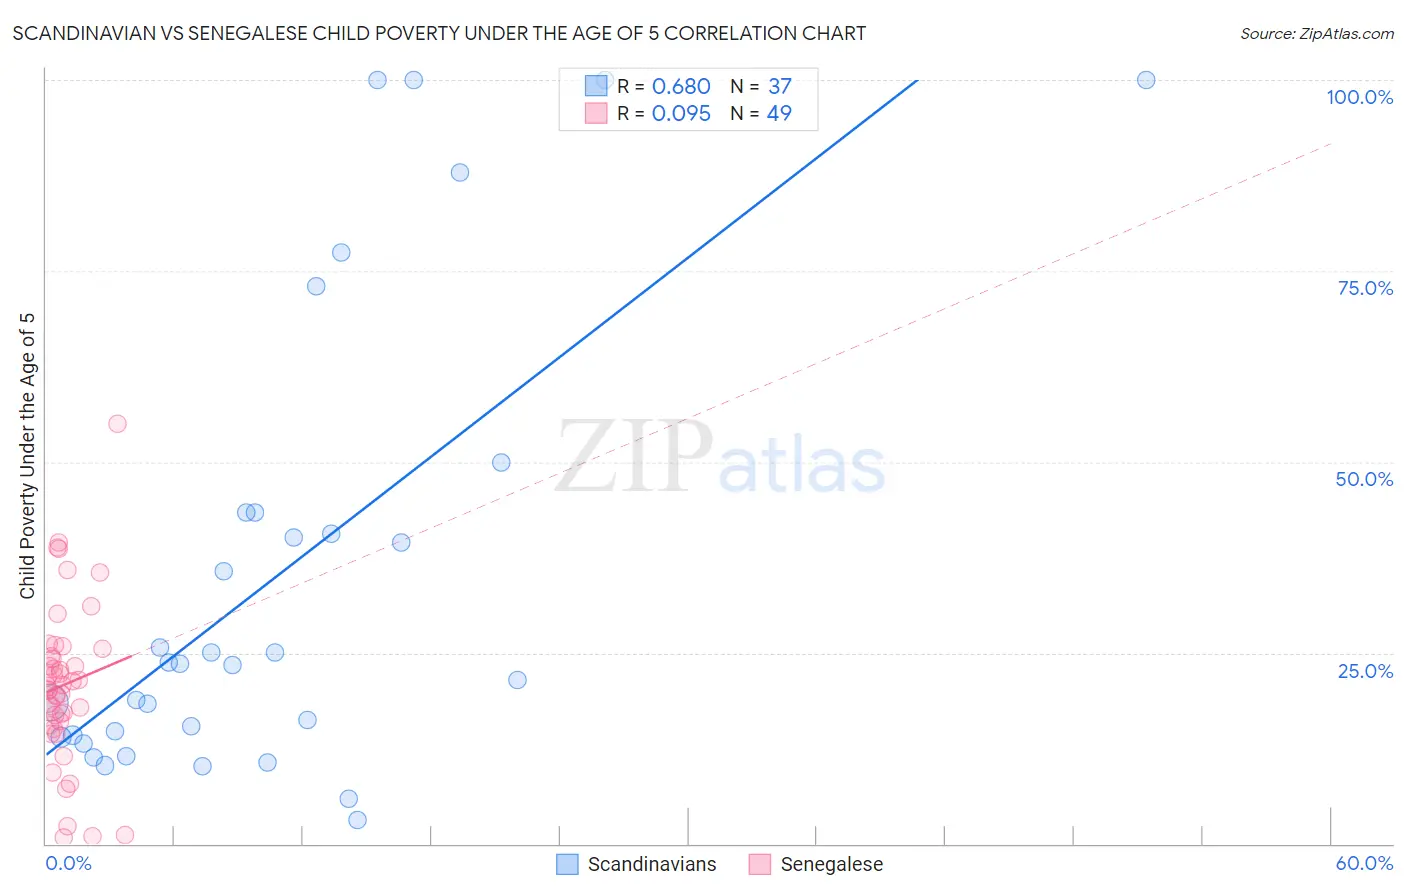
Scandinavian vs Senegalese Child Poverty Under the Age of 5 Correlation Chart
The statistical analysis conducted on geographies consisting of 447,069,136 people shows a significant positive correlation between the proportion of Scandinavians and poverty level among children under the age of 5 in the United States with a correlation coefficient (R) of 0.680 and weighted average of 15.7%. Similarly, the statistical analysis conducted on geographies consisting of 77,581,902 people shows a slight positive correlation between the proportion of Senegalese and poverty level among children under the age of 5 in the United States with a correlation coefficient (R) of 0.095 and weighted average of 20.9%, a difference of 33.4%.
Child Poverty Under the Age of 5 Correlation Summary
| Measurement | Scandinavian | Senegalese |
| Minimum | 3.2% | 0.87% |
| Maximum | 100.0% | 55.0% |
| Range | 96.8% | 54.1% |
| Mean | 35.3% | 20.8% |
| Median | 23.5% | 20.6% |
| Interquartile 25% (IQ1) | 14.0% | 15.8% |
| Interquartile 75% (IQ3) | 43.4% | 25.1% |
| Interquartile Range (IQR) | 29.4% | 9.3% |
| Standard Deviation (Sample) | 30.0% | 10.5% |
| Standard Deviation (Population) | 29.6% | 10.4% |
Similar Demographics by Child Poverty Under the Age of 5
Demographics Similar to Scandinavians by Child Poverty Under the Age of 5
In terms of child poverty under the age of 5, the demographic groups most similar to Scandinavians are Ukrainian (15.7%, a difference of 0.020%), Immigrants from South Eastern Asia (15.7%, a difference of 0.040%), Polish (15.7%, a difference of 0.060%), Immigrants from France (15.6%, a difference of 0.17%), and Immigrants from Croatia (15.6%, a difference of 0.18%).
| Demographics | Rating | Rank | Child Poverty Under the Age of 5 |
| Immigrants | Latvia | 97.4 /100 | #85 | Exceptional 15.6% |
| Immigrants | Malaysia | 97.4 /100 | #86 | Exceptional 15.6% |
| Immigrants | Vietnam | 97.4 /100 | #87 | Exceptional 15.6% |
| Jordanians | 97.3 /100 | #88 | Exceptional 15.6% |
| Immigrants | Croatia | 97.3 /100 | #89 | Exceptional 15.6% |
| Immigrants | France | 97.3 /100 | #90 | Exceptional 15.6% |
| Poles | 97.2 /100 | #91 | Exceptional 15.7% |
| Scandinavians | 97.1 /100 | #92 | Exceptional 15.7% |
| Ukrainians | 97.1 /100 | #93 | Exceptional 15.7% |
| Immigrants | South Eastern Asia | 97.1 /100 | #94 | Exceptional 15.7% |
| Immigrants | Switzerland | 96.4 /100 | #95 | Exceptional 15.8% |
| Immigrants | Kazakhstan | 96.2 /100 | #96 | Exceptional 15.8% |
| Macedonians | 96.2 /100 | #97 | Exceptional 15.8% |
| Immigrants | South Africa | 96.1 /100 | #98 | Exceptional 15.8% |
| Palestinians | 95.9 /100 | #99 | Exceptional 15.8% |
Demographics Similar to Senegalese by Child Poverty Under the Age of 5
In terms of child poverty under the age of 5, the demographic groups most similar to Senegalese are French American Indian (20.8%, a difference of 0.23%), Potawatomi (21.0%, a difference of 0.54%), Subsaharan African (20.8%, a difference of 0.64%), Comanche (21.0%, a difference of 0.74%), and Immigrants from Grenada (20.7%, a difference of 1.0%).
| Demographics | Rating | Rank | Child Poverty Under the Age of 5 |
| Immigrants | Belize | 0.1 /100 | #274 | Tragic 20.6% |
| Bangladeshis | 0.1 /100 | #275 | Tragic 20.6% |
| West Indians | 0.0 /100 | #276 | Tragic 20.6% |
| Immigrants | West Indies | 0.0 /100 | #277 | Tragic 20.7% |
| Immigrants | Grenada | 0.0 /100 | #278 | Tragic 20.7% |
| Sub-Saharan Africans | 0.0 /100 | #279 | Tragic 20.8% |
| French American Indians | 0.0 /100 | #280 | Tragic 20.8% |
| Senegalese | 0.0 /100 | #281 | Tragic 20.9% |
| Potawatomi | 0.0 /100 | #282 | Tragic 21.0% |
| Comanche | 0.0 /100 | #283 | Tragic 21.0% |
| Somalis | 0.0 /100 | #284 | Tragic 21.1% |
| Haitians | 0.0 /100 | #285 | Tragic 21.2% |
| Immigrants | Latin America | 0.0 /100 | #286 | Tragic 21.2% |
| Immigrants | Zaire | 0.0 /100 | #287 | Tragic 21.3% |
| Immigrants | Senegal | 0.0 /100 | #288 | Tragic 21.3% |