Scandinavian vs Paiute Child Poverty Under the Age of 5
COMPARE
Scandinavian
Paiute
Child Poverty Under the Age of 5
Child Poverty Under the Age of 5 Comparison
Scandinavians
Paiute
15.7%
CHILD POVERTY UNDER THE AGE OF 5
97.1/ 100
METRIC RATING
92nd/ 347
METRIC RANK
23.8%
CHILD POVERTY UNDER THE AGE OF 5
0.0/ 100
METRIC RATING
324th/ 347
METRIC RANK
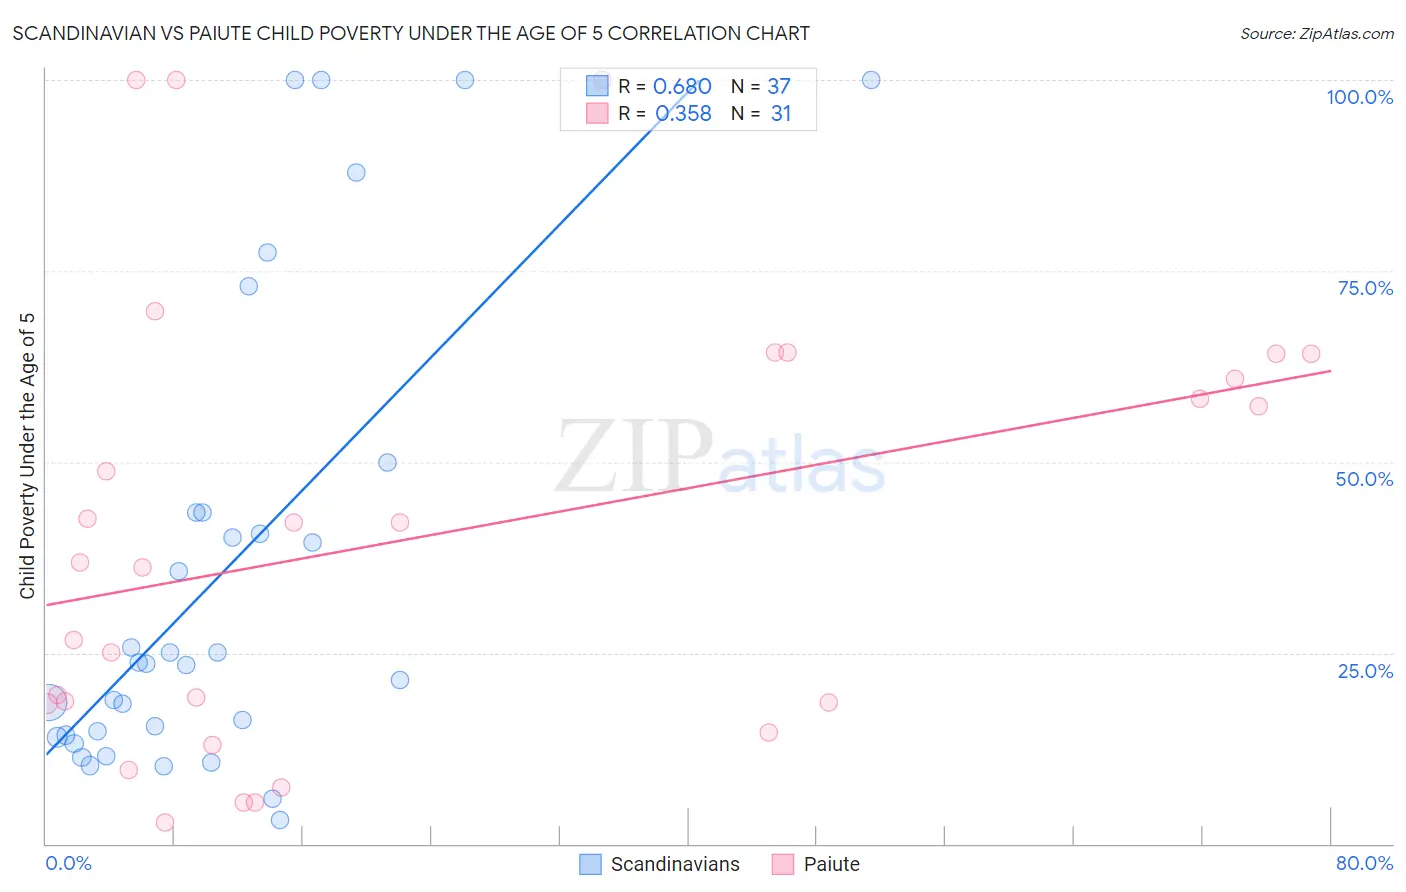
Scandinavian vs Paiute Child Poverty Under the Age of 5 Correlation Chart
The statistical analysis conducted on geographies consisting of 447,069,136 people shows a significant positive correlation between the proportion of Scandinavians and poverty level among children under the age of 5 in the United States with a correlation coefficient (R) of 0.680 and weighted average of 15.7%. Similarly, the statistical analysis conducted on geographies consisting of 58,012,157 people shows a mild positive correlation between the proportion of Paiute and poverty level among children under the age of 5 in the United States with a correlation coefficient (R) of 0.358 and weighted average of 23.8%, a difference of 52.1%.
Child Poverty Under the Age of 5 Correlation Summary
| Measurement | Scandinavian | Paiute |
| Minimum | 3.2% | 2.7% |
| Maximum | 100.0% | 100.0% |
| Range | 96.8% | 97.3% |
| Mean | 35.3% | 40.5% |
| Median | 23.5% | 36.7% |
| Interquartile 25% (IQ1) | 14.0% | 18.4% |
| Interquartile 75% (IQ3) | 43.4% | 64.1% |
| Interquartile Range (IQR) | 29.4% | 45.7% |
| Standard Deviation (Sample) | 30.0% | 28.9% |
| Standard Deviation (Population) | 29.6% | 28.4% |
Similar Demographics by Child Poverty Under the Age of 5
Demographics Similar to Scandinavians by Child Poverty Under the Age of 5
In terms of child poverty under the age of 5, the demographic groups most similar to Scandinavians are Ukrainian (15.7%, a difference of 0.020%), Immigrants from South Eastern Asia (15.7%, a difference of 0.040%), Polish (15.7%, a difference of 0.060%), Immigrants from France (15.6%, a difference of 0.17%), and Immigrants from Croatia (15.6%, a difference of 0.18%).
| Demographics | Rating | Rank | Child Poverty Under the Age of 5 |
| Immigrants | Latvia | 97.4 /100 | #85 | Exceptional 15.6% |
| Immigrants | Malaysia | 97.4 /100 | #86 | Exceptional 15.6% |
| Immigrants | Vietnam | 97.4 /100 | #87 | Exceptional 15.6% |
| Jordanians | 97.3 /100 | #88 | Exceptional 15.6% |
| Immigrants | Croatia | 97.3 /100 | #89 | Exceptional 15.6% |
| Immigrants | France | 97.3 /100 | #90 | Exceptional 15.6% |
| Poles | 97.2 /100 | #91 | Exceptional 15.7% |
| Scandinavians | 97.1 /100 | #92 | Exceptional 15.7% |
| Ukrainians | 97.1 /100 | #93 | Exceptional 15.7% |
| Immigrants | South Eastern Asia | 97.1 /100 | #94 | Exceptional 15.7% |
| Immigrants | Switzerland | 96.4 /100 | #95 | Exceptional 15.8% |
| Immigrants | Kazakhstan | 96.2 /100 | #96 | Exceptional 15.8% |
| Macedonians | 96.2 /100 | #97 | Exceptional 15.8% |
| Immigrants | South Africa | 96.1 /100 | #98 | Exceptional 15.8% |
| Palestinians | 95.9 /100 | #99 | Exceptional 15.8% |
Demographics Similar to Paiute by Child Poverty Under the Age of 5
In terms of child poverty under the age of 5, the demographic groups most similar to Paiute are Immigrants from Congo (23.9%, a difference of 0.21%), Central American Indian (23.9%, a difference of 0.39%), Pueblo (23.7%, a difference of 0.61%), Dominican (24.0%, a difference of 0.85%), and Immigrants from Dominican Republic (24.1%, a difference of 0.94%).
| Demographics | Rating | Rank | Child Poverty Under the Age of 5 |
| Menominee | 0.0 /100 | #317 | Tragic 23.3% |
| Dutch West Indians | 0.0 /100 | #318 | Tragic 23.3% |
| Chippewa | 0.0 /100 | #319 | Tragic 23.4% |
| Choctaw | 0.0 /100 | #320 | Tragic 23.5% |
| Immigrants | Honduras | 0.0 /100 | #321 | Tragic 23.5% |
| Ute | 0.0 /100 | #322 | Tragic 23.5% |
| Pueblo | 0.0 /100 | #323 | Tragic 23.7% |
| Paiute | 0.0 /100 | #324 | Tragic 23.8% |
| Immigrants | Congo | 0.0 /100 | #325 | Tragic 23.9% |
| Central American Indians | 0.0 /100 | #326 | Tragic 23.9% |
| Dominicans | 0.0 /100 | #327 | Tragic 24.0% |
| Immigrants | Dominican Republic | 0.0 /100 | #328 | Tragic 24.1% |
| Cajuns | 0.0 /100 | #329 | Tragic 24.1% |
| Creek | 0.0 /100 | #330 | Tragic 24.2% |
| Kiowa | 0.0 /100 | #331 | Tragic 24.5% |