Scandinavian vs Immigrants from Panama Child Poverty Under the Age of 5
COMPARE
Scandinavian
Immigrants from Panama
Child Poverty Under the Age of 5
Child Poverty Under the Age of 5 Comparison
Scandinavians
Immigrants from Panama
15.7%
CHILD POVERTY UNDER THE AGE OF 5
97.1/ 100
METRIC RATING
92nd/ 347
METRIC RANK
18.5%
CHILD POVERTY UNDER THE AGE OF 5
6.0/ 100
METRIC RATING
215th/ 347
METRIC RANK
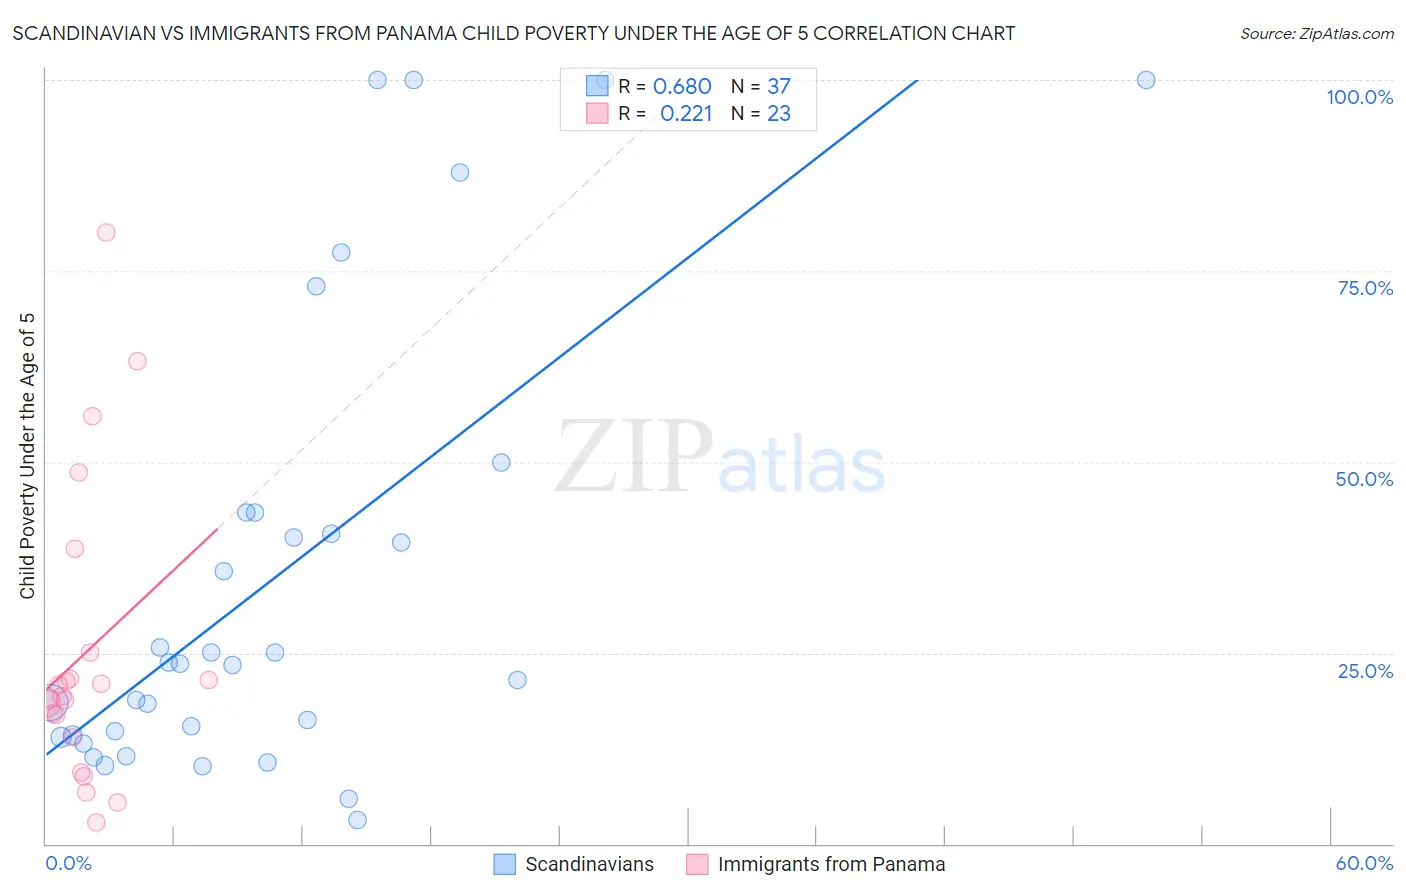
Scandinavian vs Immigrants from Panama Child Poverty Under the Age of 5 Correlation Chart
The statistical analysis conducted on geographies consisting of 447,069,136 people shows a significant positive correlation between the proportion of Scandinavians and poverty level among children under the age of 5 in the United States with a correlation coefficient (R) of 0.680 and weighted average of 15.7%. Similarly, the statistical analysis conducted on geographies consisting of 217,169,883 people shows a weak positive correlation between the proportion of Immigrants from Panama and poverty level among children under the age of 5 in the United States with a correlation coefficient (R) of 0.221 and weighted average of 18.5%, a difference of 17.9%.
Child Poverty Under the Age of 5 Correlation Summary
| Measurement | Scandinavian | Immigrants from Panama |
| Minimum | 3.2% | 2.7% |
| Maximum | 100.0% | 80.0% |
| Range | 96.8% | 77.3% |
| Mean | 35.3% | 25.0% |
| Median | 23.5% | 19.4% |
| Interquartile 25% (IQ1) | 14.0% | 14.0% |
| Interquartile 75% (IQ3) | 43.4% | 25.1% |
| Interquartile Range (IQR) | 29.4% | 11.1% |
| Standard Deviation (Sample) | 30.0% | 19.5% |
| Standard Deviation (Population) | 29.6% | 19.1% |
Similar Demographics by Child Poverty Under the Age of 5
Demographics Similar to Scandinavians by Child Poverty Under the Age of 5
In terms of child poverty under the age of 5, the demographic groups most similar to Scandinavians are Ukrainian (15.7%, a difference of 0.020%), Immigrants from South Eastern Asia (15.7%, a difference of 0.040%), Polish (15.7%, a difference of 0.060%), Immigrants from France (15.6%, a difference of 0.17%), and Immigrants from Croatia (15.6%, a difference of 0.18%).
| Demographics | Rating | Rank | Child Poverty Under the Age of 5 |
| Immigrants | Latvia | 97.4 /100 | #85 | Exceptional 15.6% |
| Immigrants | Malaysia | 97.4 /100 | #86 | Exceptional 15.6% |
| Immigrants | Vietnam | 97.4 /100 | #87 | Exceptional 15.6% |
| Jordanians | 97.3 /100 | #88 | Exceptional 15.6% |
| Immigrants | Croatia | 97.3 /100 | #89 | Exceptional 15.6% |
| Immigrants | France | 97.3 /100 | #90 | Exceptional 15.6% |
| Poles | 97.2 /100 | #91 | Exceptional 15.7% |
| Scandinavians | 97.1 /100 | #92 | Exceptional 15.7% |
| Ukrainians | 97.1 /100 | #93 | Exceptional 15.7% |
| Immigrants | South Eastern Asia | 97.1 /100 | #94 | Exceptional 15.7% |
| Immigrants | Switzerland | 96.4 /100 | #95 | Exceptional 15.8% |
| Immigrants | Kazakhstan | 96.2 /100 | #96 | Exceptional 15.8% |
| Macedonians | 96.2 /100 | #97 | Exceptional 15.8% |
| Immigrants | South Africa | 96.1 /100 | #98 | Exceptional 15.8% |
| Palestinians | 95.9 /100 | #99 | Exceptional 15.8% |
Demographics Similar to Immigrants from Panama by Child Poverty Under the Age of 5
In terms of child poverty under the age of 5, the demographic groups most similar to Immigrants from Panama are Malaysian (18.4%, a difference of 0.20%), Hmong (18.5%, a difference of 0.46%), Immigrants from Africa (18.6%, a difference of 0.66%), Immigrants from Thailand (18.3%, a difference of 0.97%), and Nepalese (18.3%, a difference of 0.99%).
| Demographics | Rating | Rank | Child Poverty Under the Age of 5 |
| Scotch-Irish | 9.8 /100 | #208 | Tragic 18.2% |
| Spanish | 9.8 /100 | #209 | Tragic 18.2% |
| Panamanians | 9.7 /100 | #210 | Tragic 18.2% |
| Moroccans | 9.4 /100 | #211 | Tragic 18.2% |
| Nepalese | 8.7 /100 | #212 | Tragic 18.3% |
| Immigrants | Thailand | 8.6 /100 | #213 | Tragic 18.3% |
| Malaysians | 6.5 /100 | #214 | Tragic 18.4% |
| Immigrants | Panama | 6.0 /100 | #215 | Tragic 18.5% |
| Hmong | 5.0 /100 | #216 | Tragic 18.5% |
| Immigrants | Africa | 4.6 /100 | #217 | Tragic 18.6% |
| Delaware | 3.4 /100 | #218 | Tragic 18.7% |
| German Russians | 3.0 /100 | #219 | Tragic 18.8% |
| Immigrants | Azores | 2.6 /100 | #220 | Tragic 18.9% |
| Immigrants | Nigeria | 2.1 /100 | #221 | Tragic 19.0% |
| Alsatians | 1.7 /100 | #222 | Tragic 19.1% |