White/Caucasian vs Assyrian/Chaldean/Syriac Married-Couple Family Poverty
COMPARE
White/Caucasian
Assyrian/Chaldean/Syriac
Married-Couple Family Poverty
Married-Couple Family Poverty Comparison
Whites/Caucasians
Assyrians/Chaldeans/Syriacs
4.8%
MARRIED-COUPLE FAMILY POVERTY
93.1/ 100
METRIC RATING
122nd/ 347
METRIC RANK
4.9%
MARRIED-COUPLE FAMILY POVERTY
89.4/ 100
METRIC RATING
135th/ 347
METRIC RANK
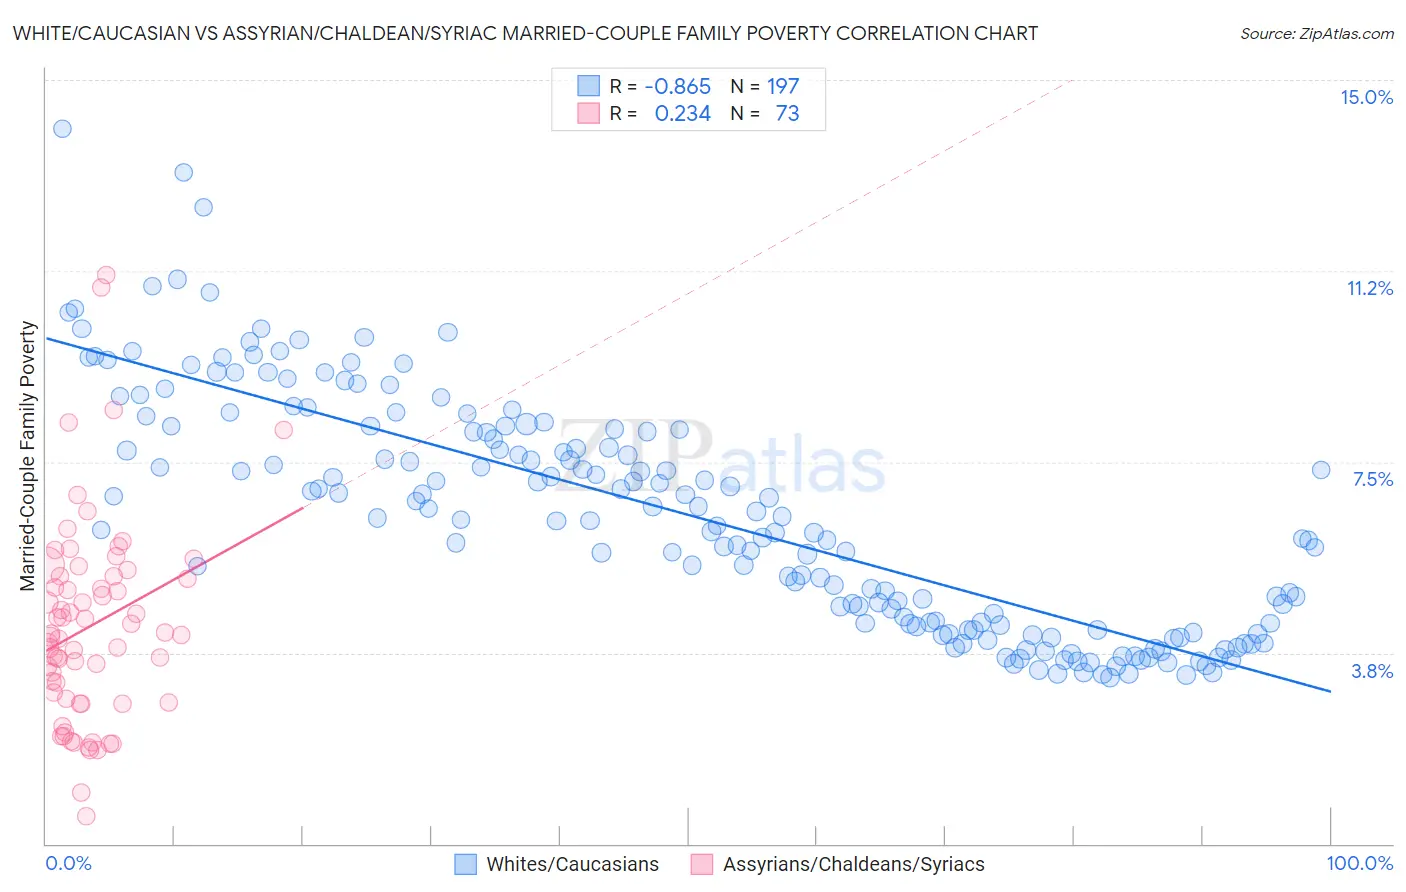
White/Caucasian vs Assyrian/Chaldean/Syriac Married-Couple Family Poverty Correlation Chart
The statistical analysis conducted on geographies consisting of 566,545,567 people shows a very strong negative correlation between the proportion of Whites/Caucasians and poverty level among married-couple families in the United States with a correlation coefficient (R) of -0.865 and weighted average of 4.8%. Similarly, the statistical analysis conducted on geographies consisting of 109,936,047 people shows a weak positive correlation between the proportion of Assyrians/Chaldeans/Syriacs and poverty level among married-couple families in the United States with a correlation coefficient (R) of 0.234 and weighted average of 4.9%, a difference of 1.5%.
Married-Couple Family Poverty Correlation Summary
| Measurement | White/Caucasian | Assyrian/Chaldean/Syriac |
| Minimum | 3.3% | 0.54% |
| Maximum | 14.0% | 11.2% |
| Range | 10.8% | 10.6% |
| Mean | 6.4% | 4.3% |
| Median | 6.3% | 4.1% |
| Interquartile 25% (IQ1) | 4.3% | 2.8% |
| Interquartile 75% (IQ3) | 8.1% | 5.2% |
| Interquartile Range (IQR) | 3.9% | 2.4% |
| Standard Deviation (Sample) | 2.3% | 2.0% |
| Standard Deviation (Population) | 2.3% | 2.0% |
Demographics Similar to Whites/Caucasians and Assyrians/Chaldeans/Syriacs by Married-Couple Family Poverty
In terms of married-couple family poverty, the demographic groups most similar to Whites/Caucasians are Jordanian (4.8%, a difference of 0.020%), Indian (Asian) (4.8%, a difference of 0.050%), Immigrants from Southern Europe (4.8%, a difference of 0.14%), Romanian (4.8%, a difference of 0.29%), and Immigrants from Bosnia and Herzegovina (4.8%, a difference of 0.30%). Similarly, the demographic groups most similar to Assyrians/Chaldeans/Syriacs are Immigrants from Hungary (4.9%, a difference of 0.22%), Samoan (4.9%, a difference of 0.28%), Immigrants from Kenya (4.9%, a difference of 0.29%), Puget Sound Salish (4.9%, a difference of 0.36%), and Immigrants from Eastern Europe (4.9%, a difference of 0.37%).
| Demographics | Rating | Rank | Married-Couple Family Poverty |
| Immigrants | Philippines | 94.6 /100 | #118 | Exceptional 4.8% |
| Immigrants | Eastern Asia | 94.0 /100 | #119 | Exceptional 4.8% |
| Immigrants | Southern Europe | 93.4 /100 | #120 | Exceptional 4.8% |
| Indians (Asian) | 93.2 /100 | #121 | Exceptional 4.8% |
| Whites/Caucasians | 93.1 /100 | #122 | Exceptional 4.8% |
| Jordanians | 93.1 /100 | #123 | Exceptional 4.8% |
| Romanians | 92.5 /100 | #124 | Exceptional 4.8% |
| Immigrants | Bosnia and Herzegovina | 92.5 /100 | #125 | Exceptional 4.8% |
| Immigrants | Asia | 92.3 /100 | #126 | Exceptional 4.8% |
| Egyptians | 92.0 /100 | #127 | Exceptional 4.8% |
| Palestinians | 91.2 /100 | #128 | Exceptional 4.9% |
| Immigrants | Pakistan | 90.7 /100 | #129 | Exceptional 4.9% |
| Soviet Union | 90.7 /100 | #130 | Exceptional 4.9% |
| Immigrants | Eastern Europe | 90.5 /100 | #131 | Exceptional 4.9% |
| Puget Sound Salish | 90.4 /100 | #132 | Exceptional 4.9% |
| Immigrants | Kenya | 90.2 /100 | #133 | Exceptional 4.9% |
| Samoans | 90.2 /100 | #134 | Exceptional 4.9% |
| Assyrians/Chaldeans/Syriacs | 89.4 /100 | #135 | Excellent 4.9% |
| Immigrants | Hungary | 88.7 /100 | #136 | Excellent 4.9% |
| Guamanians/Chamorros | 86.5 /100 | #137 | Excellent 4.9% |
| Chileans | 86.0 /100 | #138 | Excellent 4.9% |