Yup'ik vs Assyrian/Chaldean/Syriac Vision Disability
COMPARE
Yup'ik
Assyrian/Chaldean/Syriac
Vision Disability
Vision Disability Comparison
Yup'ik
Assyrians/Chaldeans/Syriacs
2.7%
VISION DISABILITY
0.0/ 100
METRIC RATING
317th/ 347
METRIC RANK
2.0%
VISION DISABILITY
98.1/ 100
METRIC RATING
79th/ 347
METRIC RANK
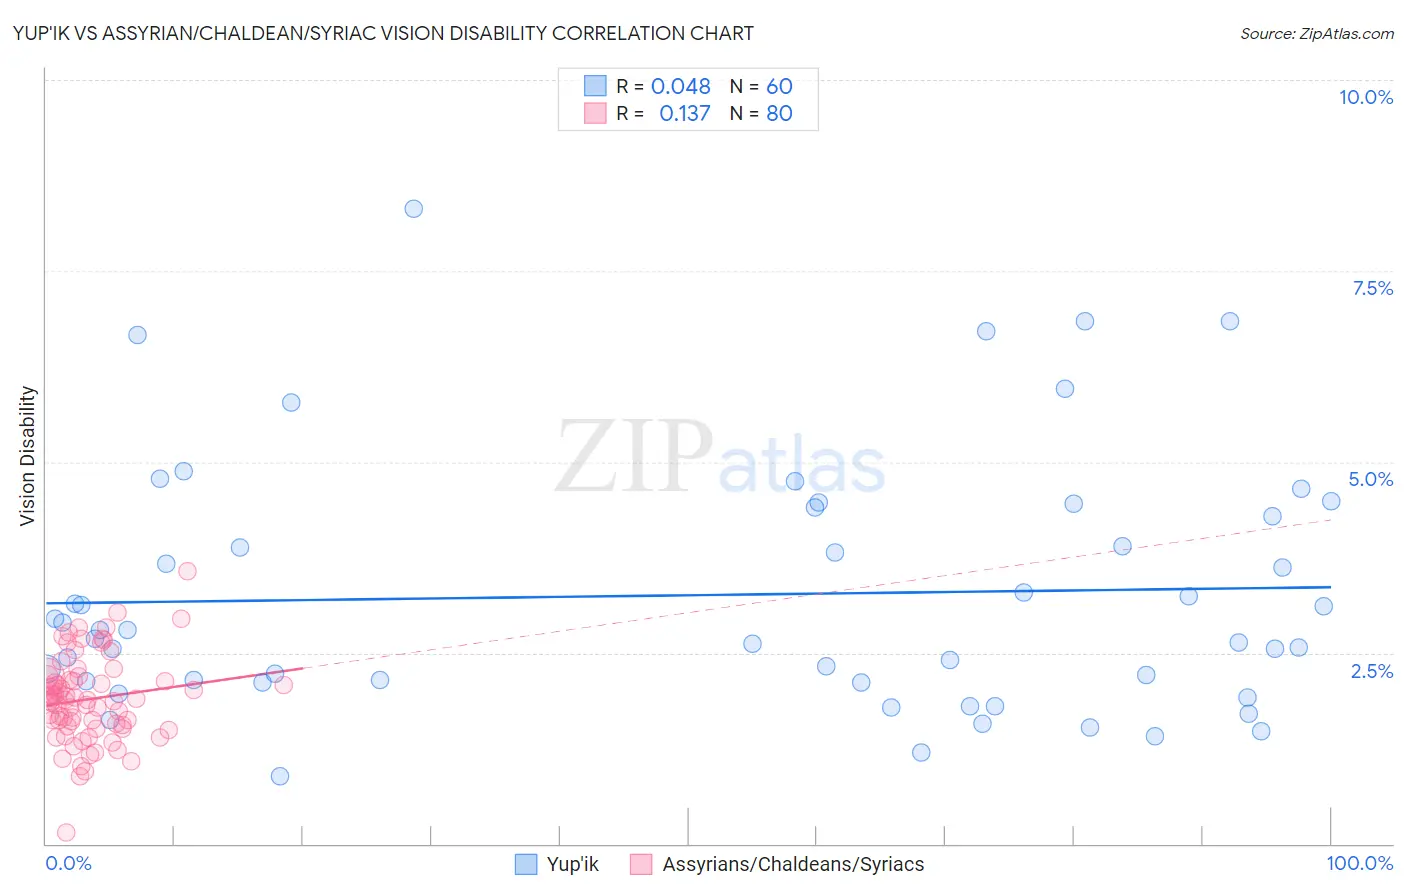
Yup'ik vs Assyrian/Chaldean/Syriac Vision Disability Correlation Chart
The statistical analysis conducted on geographies consisting of 39,951,250 people shows no correlation between the proportion of Yup'ik and percentage of population with vision disability in the United States with a correlation coefficient (R) of 0.048 and weighted average of 2.7%. Similarly, the statistical analysis conducted on geographies consisting of 110,300,168 people shows a poor positive correlation between the proportion of Assyrians/Chaldeans/Syriacs and percentage of population with vision disability in the United States with a correlation coefficient (R) of 0.137 and weighted average of 2.0%, a difference of 32.8%.
Vision Disability Correlation Summary
| Measurement | Yup'ik | Assyrian/Chaldean/Syriac |
| Minimum | 0.88% | 0.15% |
| Maximum | 8.3% | 3.6% |
| Range | 7.4% | 3.4% |
| Mean | 3.3% | 1.9% |
| Median | 2.7% | 1.9% |
| Interquartile 25% (IQ1) | 2.1% | 1.6% |
| Interquartile 75% (IQ3) | 4.3% | 2.2% |
| Interquartile Range (IQR) | 2.2% | 0.61% |
| Standard Deviation (Sample) | 1.6% | 0.57% |
| Standard Deviation (Population) | 1.6% | 0.56% |
Similar Demographics by Vision Disability
Demographics Similar to Yup'ik by Vision Disability
In terms of vision disability, the demographic groups most similar to Yup'ik are Shoshone (2.7%, a difference of 0.20%), Osage (2.7%, a difference of 0.63%), Alaska Native (2.7%, a difference of 1.1%), Inupiat (2.7%, a difference of 1.8%), and Potawatomi (2.6%, a difference of 1.9%).
| Demographics | Rating | Rank | Vision Disability |
| Blackfeet | 0.0 /100 | #310 | Tragic 2.6% |
| Dominicans | 0.0 /100 | #311 | Tragic 2.6% |
| Americans | 0.0 /100 | #312 | Tragic 2.6% |
| Potawatomi | 0.0 /100 | #313 | Tragic 2.6% |
| Inupiat | 0.0 /100 | #314 | Tragic 2.7% |
| Osage | 0.0 /100 | #315 | Tragic 2.7% |
| Shoshone | 0.0 /100 | #316 | Tragic 2.7% |
| Yup'ik | 0.0 /100 | #317 | Tragic 2.7% |
| Alaska Natives | 0.0 /100 | #318 | Tragic 2.7% |
| Tohono O'odham | 0.0 /100 | #319 | Tragic 2.8% |
| Blacks/African Americans | 0.0 /100 | #320 | Tragic 2.8% |
| Comanche | 0.0 /100 | #321 | Tragic 2.8% |
| Paiute | 0.0 /100 | #322 | Tragic 2.9% |
| Tlingit-Haida | 0.0 /100 | #323 | Tragic 2.9% |
| Hopi | 0.0 /100 | #324 | Tragic 2.9% |
Demographics Similar to Assyrians/Chaldeans/Syriacs by Vision Disability
In terms of vision disability, the demographic groups most similar to Assyrians/Chaldeans/Syriacs are Immigrants from Eastern Europe (2.0%, a difference of 0.18%), Paraguayan (2.0%, a difference of 0.21%), Immigrants from Jordan (2.0%, a difference of 0.21%), Palestinian (2.0%, a difference of 0.23%), and Immigrants from North Macedonia (2.0%, a difference of 0.23%).
| Demographics | Rating | Rank | Vision Disability |
| Immigrants | France | 98.5 /100 | #72 | Exceptional 2.0% |
| Immigrants | Eritrea | 98.4 /100 | #73 | Exceptional 2.0% |
| Palestinians | 98.3 /100 | #74 | Exceptional 2.0% |
| Immigrants | North Macedonia | 98.3 /100 | #75 | Exceptional 2.0% |
| Paraguayans | 98.3 /100 | #76 | Exceptional 2.0% |
| Immigrants | Jordan | 98.3 /100 | #77 | Exceptional 2.0% |
| Immigrants | Eastern Europe | 98.3 /100 | #78 | Exceptional 2.0% |
| Assyrians/Chaldeans/Syriacs | 98.1 /100 | #79 | Exceptional 2.0% |
| Lithuanians | 97.7 /100 | #80 | Exceptional 2.0% |
| Soviet Union | 97.6 /100 | #81 | Exceptional 2.0% |
| Immigrants | Poland | 97.6 /100 | #82 | Exceptional 2.0% |
| Immigrants | Western Asia | 97.5 /100 | #83 | Exceptional 2.0% |
| Immigrants | Latvia | 97.3 /100 | #84 | Exceptional 2.0% |
| Chinese | 97.2 /100 | #85 | Exceptional 2.0% |
| Immigrants | Moldova | 97.2 /100 | #86 | Exceptional 2.0% |