Israeli vs Assyrian/Chaldean/Syriac Married-Couple Family Poverty
COMPARE
Israeli
Assyrian/Chaldean/Syriac
Married-Couple Family Poverty
Married-Couple Family Poverty Comparison
Israelis
Assyrians/Chaldeans/Syriacs
5.3%
MARRIED-COUPLE FAMILY POVERTY
33.1/ 100
METRIC RATING
188th/ 347
METRIC RANK
4.9%
MARRIED-COUPLE FAMILY POVERTY
89.4/ 100
METRIC RATING
135th/ 347
METRIC RANK
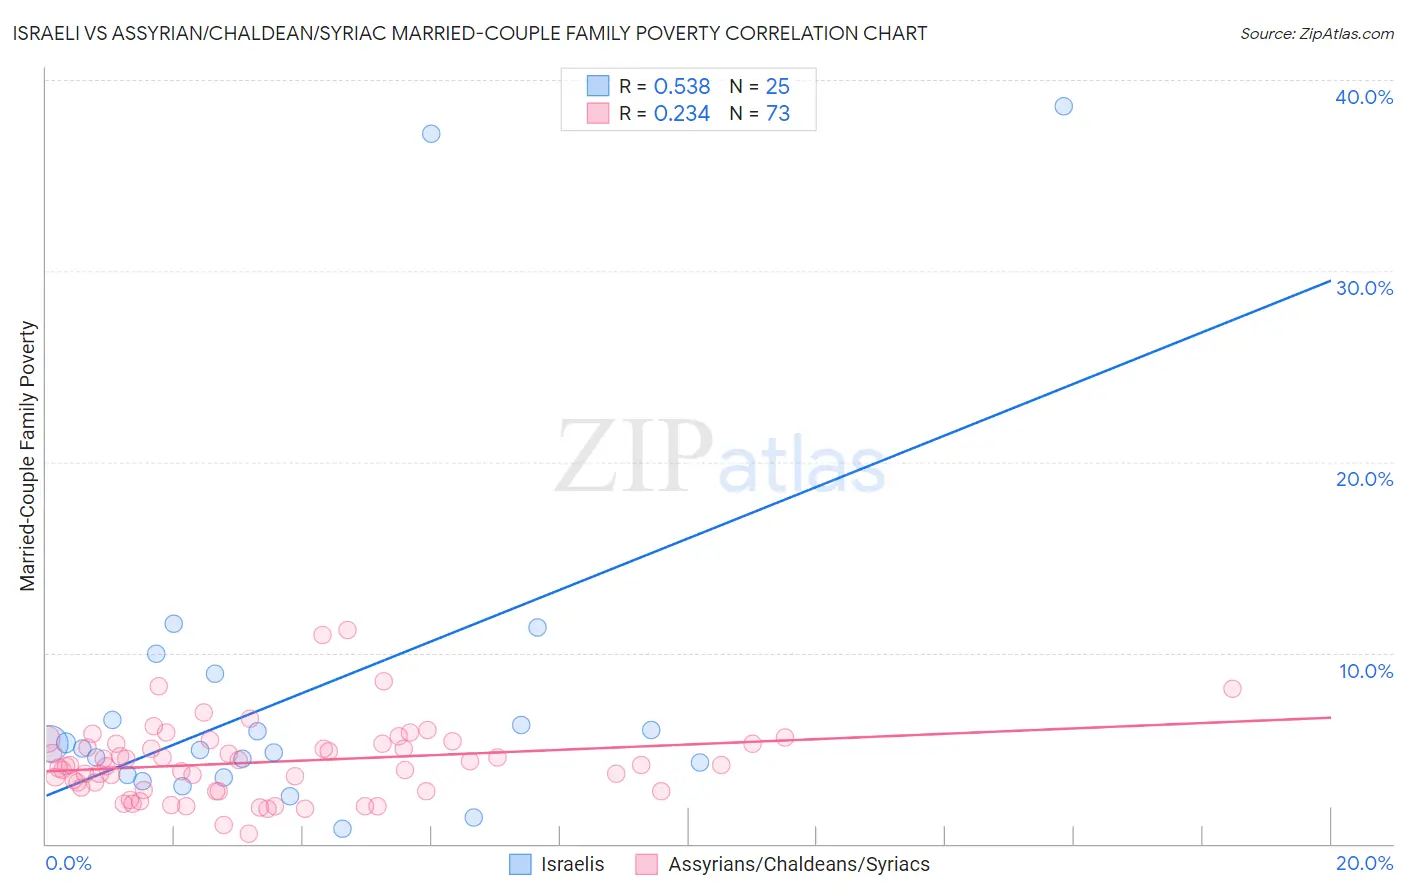
Israeli vs Assyrian/Chaldean/Syriac Married-Couple Family Poverty Correlation Chart
The statistical analysis conducted on geographies consisting of 209,909,824 people shows a substantial positive correlation between the proportion of Israelis and poverty level among married-couple families in the United States with a correlation coefficient (R) of 0.538 and weighted average of 5.3%. Similarly, the statistical analysis conducted on geographies consisting of 109,936,047 people shows a weak positive correlation between the proportion of Assyrians/Chaldeans/Syriacs and poverty level among married-couple families in the United States with a correlation coefficient (R) of 0.234 and weighted average of 4.9%, a difference of 8.8%.
Married-Couple Family Poverty Correlation Summary
| Measurement | Israeli | Assyrian/Chaldean/Syriac |
| Minimum | 0.81% | 0.54% |
| Maximum | 38.6% | 11.2% |
| Range | 37.8% | 10.6% |
| Mean | 7.9% | 4.3% |
| Median | 5.0% | 4.1% |
| Interquartile 25% (IQ1) | 3.5% | 2.8% |
| Interquartile 75% (IQ3) | 7.7% | 5.2% |
| Interquartile Range (IQR) | 4.1% | 2.4% |
| Standard Deviation (Sample) | 9.4% | 2.0% |
| Standard Deviation (Population) | 9.2% | 2.0% |
Similar Demographics by Married-Couple Family Poverty
Demographics Similar to Israelis by Married-Couple Family Poverty
In terms of married-couple family poverty, the demographic groups most similar to Israelis are Immigrants from Albania (5.3%, a difference of 0.090%), South American Indian (5.3%, a difference of 0.090%), Hungarian (5.3%, a difference of 0.20%), Ugandan (5.3%, a difference of 0.20%), and American (5.3%, a difference of 0.28%).
| Demographics | Rating | Rank | Married-Couple Family Poverty |
| Immigrants | Chile | 38.8 /100 | #181 | Fair 5.3% |
| Immigrants | Vietnam | 37.7 /100 | #182 | Fair 5.3% |
| Peruvians | 37.6 /100 | #183 | Fair 5.3% |
| Immigrants | Nonimmigrants | 35.8 /100 | #184 | Fair 5.3% |
| Americans | 35.4 /100 | #185 | Fair 5.3% |
| Hungarians | 34.7 /100 | #186 | Fair 5.3% |
| Immigrants | Albania | 33.8 /100 | #187 | Fair 5.3% |
| Israelis | 33.1 /100 | #188 | Fair 5.3% |
| South American Indians | 32.5 /100 | #189 | Fair 5.3% |
| Ugandans | 31.6 /100 | #190 | Fair 5.3% |
| Immigrants | Cabo Verde | 30.9 /100 | #191 | Fair 5.3% |
| Cape Verdeans | 30.7 /100 | #192 | Fair 5.3% |
| Malaysians | 29.5 /100 | #193 | Fair 5.4% |
| Immigrants | Israel | 27.8 /100 | #194 | Fair 5.4% |
| Immigrants | Azores | 27.5 /100 | #195 | Fair 5.4% |
Demographics Similar to Assyrians/Chaldeans/Syriacs by Married-Couple Family Poverty
In terms of married-couple family poverty, the demographic groups most similar to Assyrians/Chaldeans/Syriacs are Immigrants from Hungary (4.9%, a difference of 0.22%), Samoan (4.9%, a difference of 0.28%), Immigrants from Kenya (4.9%, a difference of 0.29%), Puget Sound Salish (4.9%, a difference of 0.36%), and Immigrants from Eastern Europe (4.9%, a difference of 0.37%).
| Demographics | Rating | Rank | Married-Couple Family Poverty |
| Palestinians | 91.2 /100 | #128 | Exceptional 4.9% |
| Immigrants | Pakistan | 90.7 /100 | #129 | Exceptional 4.9% |
| Soviet Union | 90.7 /100 | #130 | Exceptional 4.9% |
| Immigrants | Eastern Europe | 90.5 /100 | #131 | Exceptional 4.9% |
| Puget Sound Salish | 90.4 /100 | #132 | Exceptional 4.9% |
| Immigrants | Kenya | 90.2 /100 | #133 | Exceptional 4.9% |
| Samoans | 90.2 /100 | #134 | Exceptional 4.9% |
| Assyrians/Chaldeans/Syriacs | 89.4 /100 | #135 | Excellent 4.9% |
| Immigrants | Hungary | 88.7 /100 | #136 | Excellent 4.9% |
| Guamanians/Chamorros | 86.5 /100 | #137 | Excellent 4.9% |
| Chileans | 86.0 /100 | #138 | Excellent 4.9% |
| German Russians | 85.1 /100 | #139 | Excellent 5.0% |
| Immigrants | Portugal | 84.8 /100 | #140 | Excellent 5.0% |
| Immigrants | Brazil | 84.6 /100 | #141 | Excellent 5.0% |
| Immigrants | China | 84.6 /100 | #142 | Excellent 5.0% |