Syrian vs Assyrian/Chaldean/Syriac Married-Couple Family Poverty
COMPARE
Syrian
Assyrian/Chaldean/Syriac
Married-Couple Family Poverty
Married-Couple Family Poverty Comparison
Syrians
Assyrians/Chaldeans/Syriacs
5.0%
MARRIED-COUPLE FAMILY POVERTY
78.7/ 100
METRIC RATING
147th/ 347
METRIC RANK
4.9%
MARRIED-COUPLE FAMILY POVERTY
89.4/ 100
METRIC RATING
135th/ 347
METRIC RANK
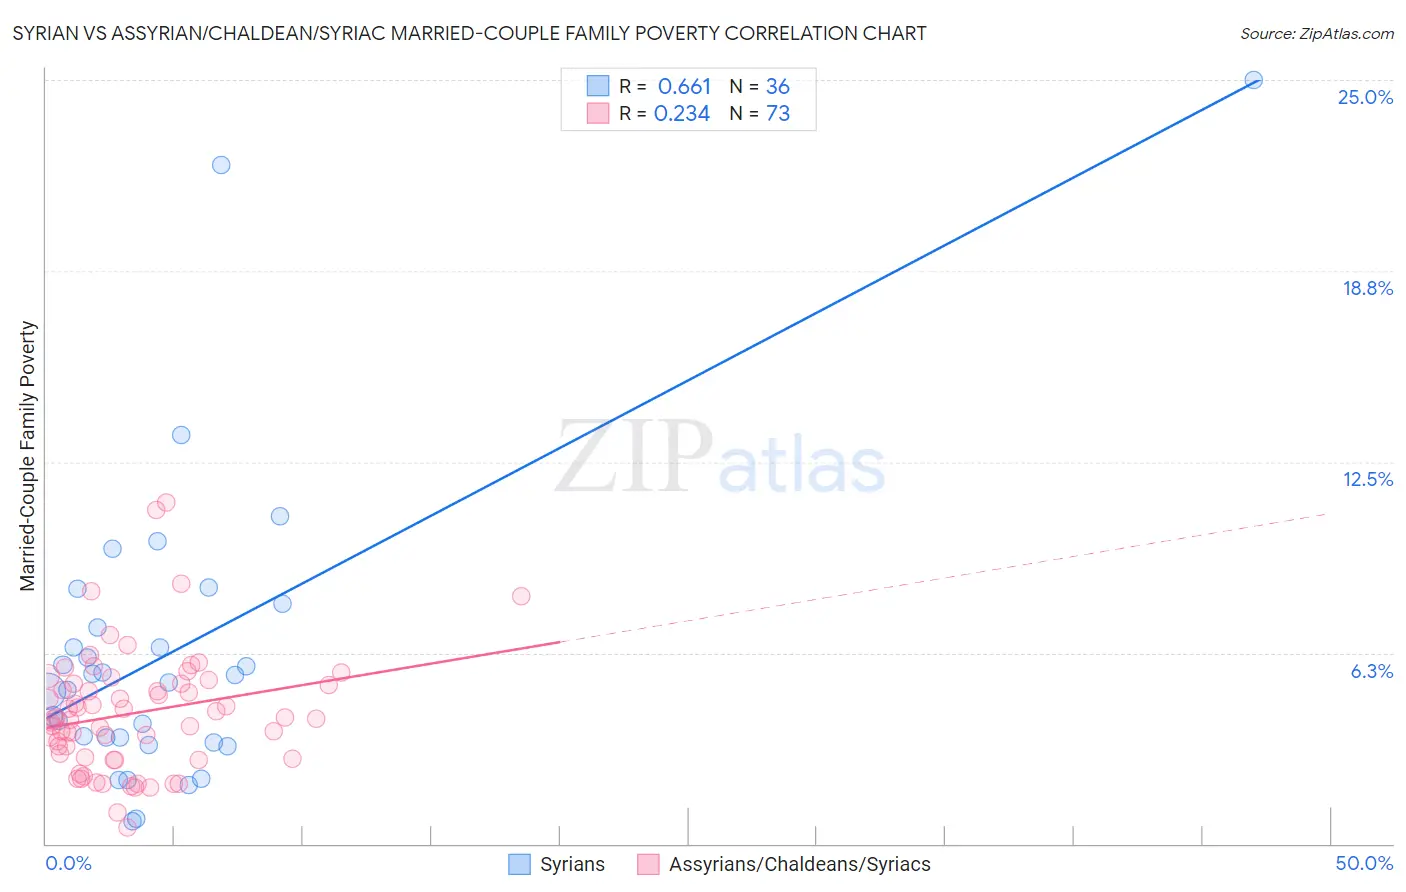
Syrian vs Assyrian/Chaldean/Syriac Married-Couple Family Poverty Correlation Chart
The statistical analysis conducted on geographies consisting of 264,506,775 people shows a significant positive correlation between the proportion of Syrians and poverty level among married-couple families in the United States with a correlation coefficient (R) of 0.661 and weighted average of 5.0%. Similarly, the statistical analysis conducted on geographies consisting of 109,936,047 people shows a weak positive correlation between the proportion of Assyrians/Chaldeans/Syriacs and poverty level among married-couple families in the United States with a correlation coefficient (R) of 0.234 and weighted average of 4.9%, a difference of 2.5%.
Married-Couple Family Poverty Correlation Summary
| Measurement | Syrian | Assyrian/Chaldean/Syriac |
| Minimum | 0.72% | 0.54% |
| Maximum | 25.0% | 11.2% |
| Range | 24.3% | 10.6% |
| Mean | 6.3% | 4.3% |
| Median | 5.4% | 4.1% |
| Interquartile 25% (IQ1) | 3.4% | 2.8% |
| Interquartile 75% (IQ3) | 7.5% | 5.2% |
| Interquartile Range (IQR) | 4.1% | 2.4% |
| Standard Deviation (Sample) | 5.1% | 2.0% |
| Standard Deviation (Population) | 5.0% | 2.0% |
Demographics Similar to Syrians and Assyrians/Chaldeans/Syriacs by Married-Couple Family Poverty
In terms of married-couple family poverty, the demographic groups most similar to Syrians are Immigrants from Russia (5.0%, a difference of 0.0%), Immigrants from Oceania (5.0%, a difference of 0.030%), Brazilian (5.0%, a difference of 0.080%), Mongolian (5.0%, a difference of 0.19%), and Immigrants from Spain (5.0%, a difference of 0.21%). Similarly, the demographic groups most similar to Assyrians/Chaldeans/Syriacs are Immigrants from Hungary (4.9%, a difference of 0.22%), Samoan (4.9%, a difference of 0.28%), Immigrants from Kenya (4.9%, a difference of 0.29%), Puget Sound Salish (4.9%, a difference of 0.36%), and Immigrants from Eastern Europe (4.9%, a difference of 0.37%).
| Demographics | Rating | Rank | Married-Couple Family Poverty |
| Immigrants | Eastern Europe | 90.5 /100 | #131 | Exceptional 4.9% |
| Puget Sound Salish | 90.4 /100 | #132 | Exceptional 4.9% |
| Immigrants | Kenya | 90.2 /100 | #133 | Exceptional 4.9% |
| Samoans | 90.2 /100 | #134 | Exceptional 4.9% |
| Assyrians/Chaldeans/Syriacs | 89.4 /100 | #135 | Excellent 4.9% |
| Immigrants | Hungary | 88.7 /100 | #136 | Excellent 4.9% |
| Guamanians/Chamorros | 86.5 /100 | #137 | Excellent 4.9% |
| Chileans | 86.0 /100 | #138 | Excellent 4.9% |
| German Russians | 85.1 /100 | #139 | Excellent 5.0% |
| Immigrants | Portugal | 84.8 /100 | #140 | Excellent 5.0% |
| Immigrants | Brazil | 84.6 /100 | #141 | Excellent 5.0% |
| Immigrants | China | 84.6 /100 | #142 | Excellent 5.0% |
| Immigrants | Egypt | 83.4 /100 | #143 | Excellent 5.0% |
| Hmong | 83.2 /100 | #144 | Excellent 5.0% |
| Immigrants | Spain | 79.9 /100 | #145 | Good 5.0% |
| Mongolians | 79.8 /100 | #146 | Good 5.0% |
| Syrians | 78.7 /100 | #147 | Good 5.0% |
| Immigrants | Russia | 78.7 /100 | #148 | Good 5.0% |
| Immigrants | Oceania | 78.6 /100 | #149 | Good 5.0% |
| Brazilians | 78.3 /100 | #150 | Good 5.0% |
| Immigrants | Cameroon | 77.3 /100 | #151 | Good 5.0% |