Yugoslavian vs American Family Poverty
COMPARE
Yugoslavian
American
Family Poverty
Family Poverty Comparison
Yugoslavians
Americans
8.5%
FAMILY POVERTY
83.5/ 100
METRIC RATING
142nd/ 347
METRIC RANK
9.8%
FAMILY POVERTY
6.2/ 100
METRIC RATING
217th/ 347
METRIC RANK
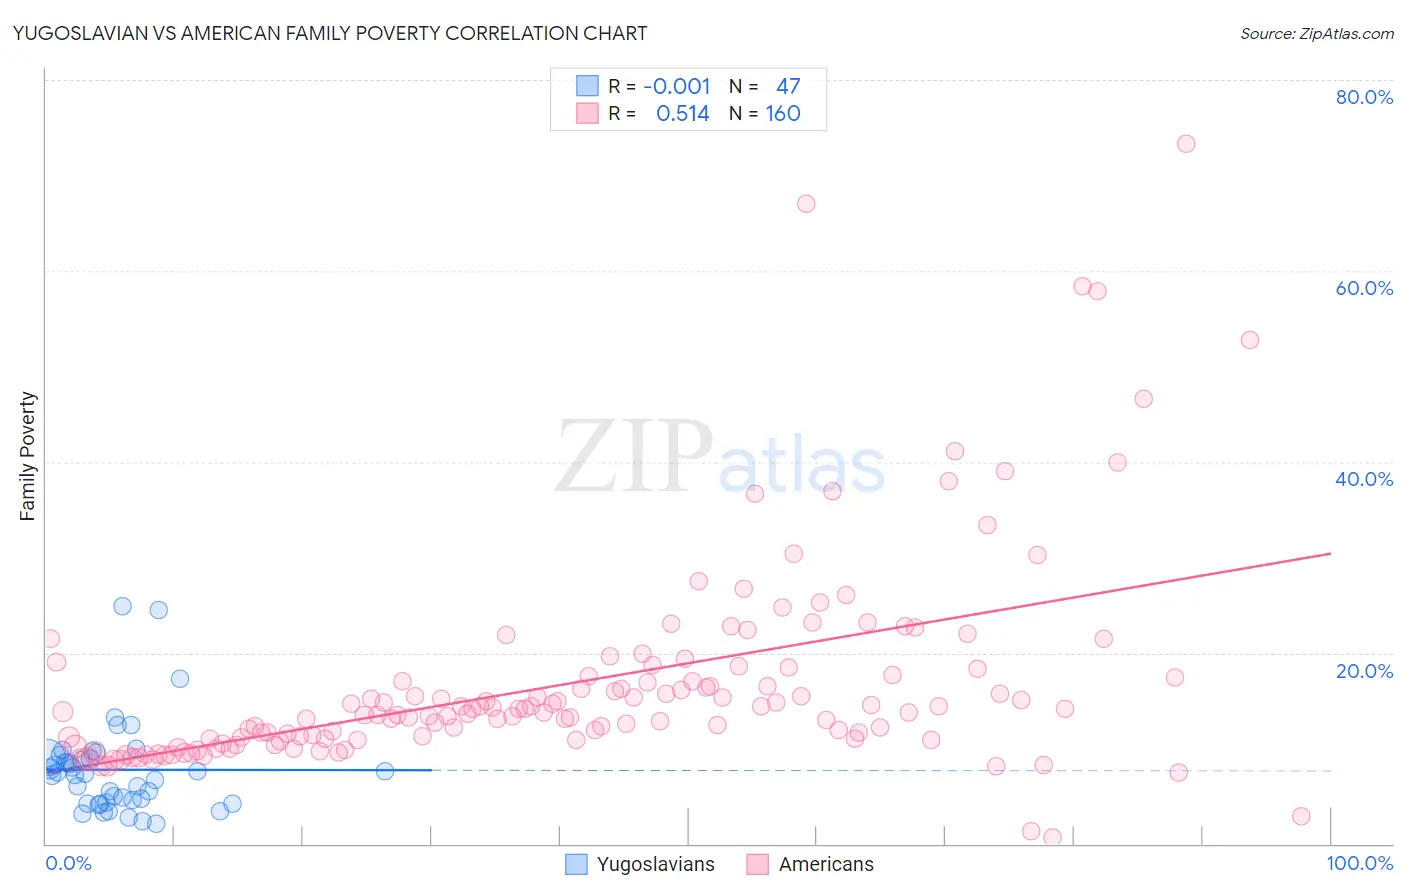
Yugoslavian vs American Family Poverty Correlation Chart
The statistical analysis conducted on geographies consisting of 285,303,830 people shows no correlation between the proportion of Yugoslavians and poverty level among families in the United States with a correlation coefficient (R) of -0.001 and weighted average of 8.5%. Similarly, the statistical analysis conducted on geographies consisting of 576,491,417 people shows a substantial positive correlation between the proportion of Americans and poverty level among families in the United States with a correlation coefficient (R) of 0.514 and weighted average of 9.8%, a difference of 15.0%.
Family Poverty Correlation Summary
| Measurement | Yugoslavian | American |
| Minimum | 2.1% | 0.65% |
| Maximum | 24.8% | 73.3% |
| Range | 22.7% | 72.7% |
| Mean | 7.7% | 16.8% |
| Median | 7.3% | 13.8% |
| Interquartile 25% (IQ1) | 4.3% | 11.0% |
| Interquartile 75% (IQ3) | 9.0% | 17.6% |
| Interquartile Range (IQR) | 4.8% | 6.6% |
| Standard Deviation (Sample) | 4.8% | 11.0% |
| Standard Deviation (Population) | 4.7% | 11.0% |
Similar Demographics by Family Poverty
Demographics Similar to Yugoslavians by Family Poverty
In terms of family poverty, the demographic groups most similar to Yugoslavians are Immigrants from Germany (8.5%, a difference of 0.030%), Albanian (8.5%, a difference of 0.050%), Immigrants from South Eastern Asia (8.5%, a difference of 0.070%), Immigrants from Belarus (8.5%, a difference of 0.080%), and Immigrants from Ukraine (8.5%, a difference of 0.11%).
| Demographics | Rating | Rank | Family Poverty |
| Immigrants | Malaysia | 86.5 /100 | #135 | Excellent 8.5% |
| Immigrants | Brazil | 86.3 /100 | #136 | Excellent 8.5% |
| Immigrants | Southern Europe | 86.0 /100 | #137 | Excellent 8.5% |
| Armenians | 84.6 /100 | #138 | Excellent 8.5% |
| Immigrants | Nepal | 84.2 /100 | #139 | Excellent 8.5% |
| Immigrants | Kazakhstan | 84.1 /100 | #140 | Excellent 8.5% |
| Immigrants | Ukraine | 83.9 /100 | #141 | Excellent 8.5% |
| Yugoslavians | 83.5 /100 | #142 | Excellent 8.5% |
| Immigrants | Germany | 83.3 /100 | #143 | Excellent 8.5% |
| Albanians | 83.3 /100 | #144 | Excellent 8.5% |
| Immigrants | South Eastern Asia | 83.2 /100 | #145 | Excellent 8.5% |
| Immigrants | Belarus | 83.2 /100 | #146 | Excellent 8.5% |
| Immigrants | Jordan | 83.0 /100 | #147 | Excellent 8.5% |
| Scotch-Irish | 82.2 /100 | #148 | Excellent 8.6% |
| Mongolians | 80.4 /100 | #149 | Excellent 8.6% |
Demographics Similar to Americans by Family Poverty
In terms of family poverty, the demographic groups most similar to Americans are Moroccan (9.8%, a difference of 0.20%), Nonimmigrants (9.8%, a difference of 0.26%), Immigrants from Micronesia (9.8%, a difference of 0.29%), Panamanian (9.8%, a difference of 0.32%), and Immigrants from Eritrea (9.9%, a difference of 0.44%).
| Demographics | Rating | Rank | Family Poverty |
| Alsatians | 11.3 /100 | #210 | Poor 9.6% |
| Malaysians | 10.6 /100 | #211 | Poor 9.6% |
| Immigrants | Thailand | 9.7 /100 | #212 | Tragic 9.7% |
| Osage | 8.0 /100 | #213 | Tragic 9.7% |
| Immigrants | Micronesia | 6.7 /100 | #214 | Tragic 9.8% |
| Immigrants | Nonimmigrants | 6.7 /100 | #215 | Tragic 9.8% |
| Moroccans | 6.5 /100 | #216 | Tragic 9.8% |
| Americans | 6.2 /100 | #217 | Tragic 9.8% |
| Panamanians | 5.6 /100 | #218 | Tragic 9.8% |
| Immigrants | Eritrea | 5.4 /100 | #219 | Tragic 9.9% |
| Bermudans | 5.3 /100 | #220 | Tragic 9.9% |
| Immigrants | Cambodia | 4.8 /100 | #221 | Tragic 9.9% |
| Japanese | 4.8 /100 | #222 | Tragic 9.9% |
| Immigrants | Africa | 4.3 /100 | #223 | Tragic 9.9% |
| Marshallese | 3.9 /100 | #224 | Tragic 9.9% |