Yugoslavian vs Immigrants from Oceania 2 or more Vehicles in Household
COMPARE
Yugoslavian
Immigrants from Oceania
2 or more Vehicles in Household
2 or more Vehicles in Household Comparison
Yugoslavians
Immigrants from Oceania
56.6%
2 OR MORE VEHICLES IN HOUSEHOLD
90.0/ 100
METRIC RATING
130th/ 347
METRIC RANK
57.5%
2 OR MORE VEHICLES IN HOUSEHOLD
98.2/ 100
METRIC RATING
106th/ 347
METRIC RANK
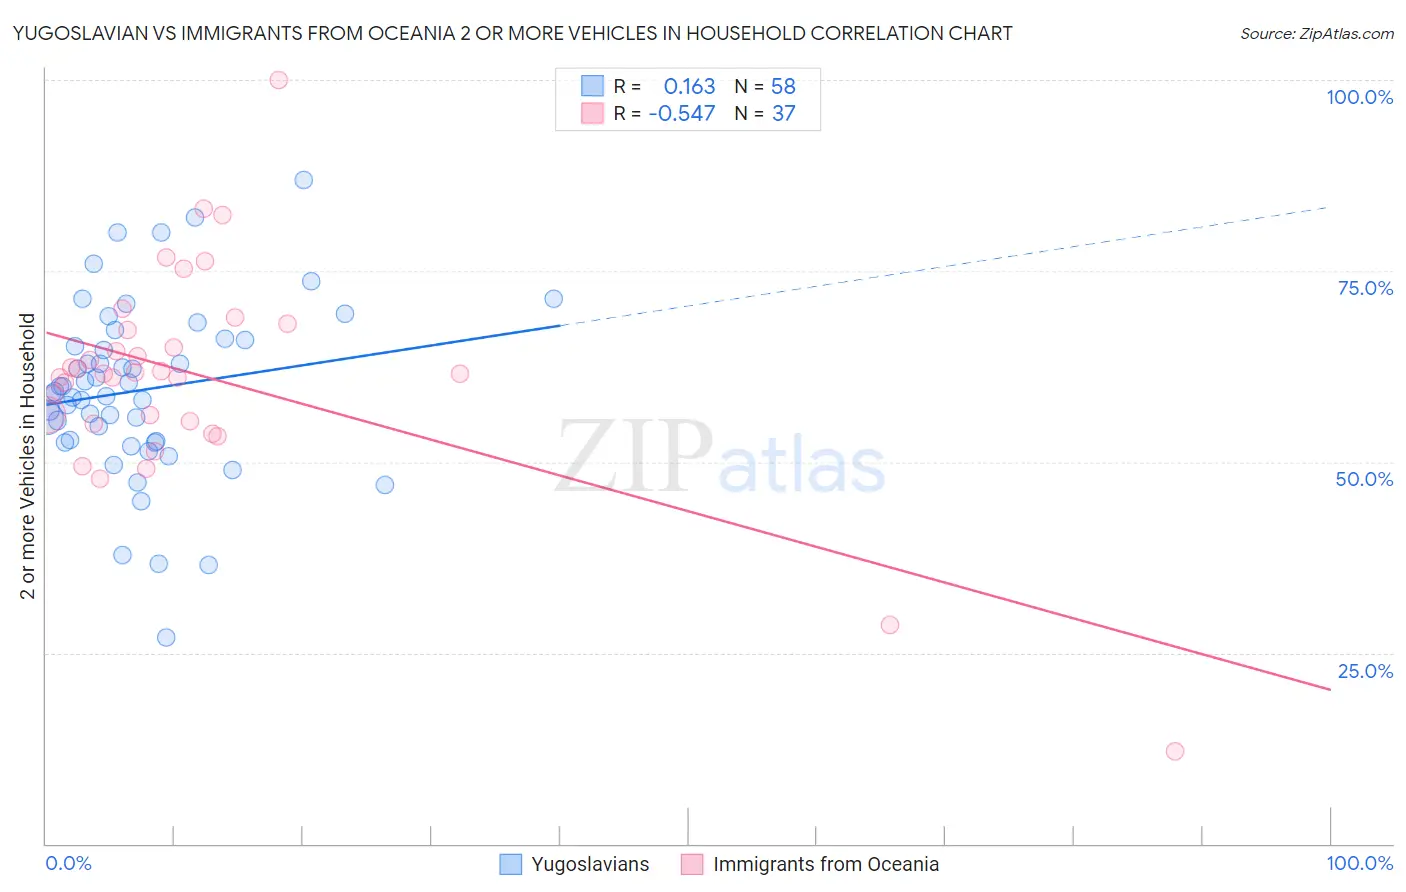
Yugoslavian vs Immigrants from Oceania 2 or more Vehicles in Household Correlation Chart
The statistical analysis conducted on geographies consisting of 285,645,335 people shows a poor positive correlation between the proportion of Yugoslavians and percentage of households with 2 or more vehicles available in the United States with a correlation coefficient (R) of 0.163 and weighted average of 56.6%. Similarly, the statistical analysis conducted on geographies consisting of 305,385,157 people shows a substantial negative correlation between the proportion of Immigrants from Oceania and percentage of households with 2 or more vehicles available in the United States with a correlation coefficient (R) of -0.547 and weighted average of 57.5%, a difference of 1.8%.
2 or more Vehicles in Household Correlation Summary
| Measurement | Yugoslavian | Immigrants from Oceania |
| Minimum | 27.0% | 12.2% |
| Maximum | 87.0% | 100.0% |
| Range | 59.9% | 87.8% |
| Mean | 59.4% | 61.2% |
| Median | 59.1% | 61.5% |
| Interquartile 25% (IQ1) | 52.7% | 55.1% |
| Interquartile 75% (IQ3) | 66.0% | 67.7% |
| Interquartile Range (IQR) | 13.3% | 12.5% |
| Standard Deviation (Sample) | 11.3% | 14.6% |
| Standard Deviation (Population) | 11.2% | 14.4% |
Similar Demographics by 2 or more Vehicles in Household
Demographics Similar to Yugoslavians by 2 or more Vehicles in Household
In terms of 2 or more vehicles in household, the demographic groups most similar to Yugoslavians are Bulgarian (56.5%, a difference of 0.030%), Ute (56.6%, a difference of 0.040%), Immigrants from South Central Asia (56.6%, a difference of 0.060%), Immigrants from Thailand (56.6%, a difference of 0.070%), and Hungarian (56.5%, a difference of 0.090%).
| Demographics | Rating | Rank | 2 or more Vehicles in Household |
| Australians | 91.8 /100 | #123 | Exceptional 56.7% |
| New Zealanders | 91.8 /100 | #124 | Exceptional 56.7% |
| Tsimshian | 91.6 /100 | #125 | Exceptional 56.7% |
| Estonians | 90.9 /100 | #126 | Exceptional 56.6% |
| Immigrants | Thailand | 90.7 /100 | #127 | Exceptional 56.6% |
| Immigrants | South Central Asia | 90.5 /100 | #128 | Exceptional 56.6% |
| Ute | 90.4 /100 | #129 | Exceptional 56.6% |
| Yugoslavians | 90.0 /100 | #130 | Exceptional 56.6% |
| Bulgarians | 89.7 /100 | #131 | Excellent 56.5% |
| Hungarians | 89.1 /100 | #132 | Excellent 56.5% |
| Comanche | 88.4 /100 | #133 | Excellent 56.5% |
| Immigrants | Azores | 86.6 /100 | #134 | Excellent 56.4% |
| Blackfeet | 86.5 /100 | #135 | Excellent 56.4% |
| Immigrants | Asia | 86.0 /100 | #136 | Excellent 56.3% |
| Cubans | 84.8 /100 | #137 | Excellent 56.3% |
Demographics Similar to Immigrants from Oceania by 2 or more Vehicles in Household
In terms of 2 or more vehicles in household, the demographic groups most similar to Immigrants from Oceania are Immigrants from Bolivia (57.6%, a difference of 0.020%), Jordanian (57.6%, a difference of 0.020%), Immigrants from Indonesia (57.6%, a difference of 0.020%), Immigrants from Korea (57.6%, a difference of 0.020%), and Immigrants from Netherlands (57.5%, a difference of 0.020%).
| Demographics | Rating | Rank | 2 or more Vehicles in Household |
| Cajuns | 98.5 /100 | #99 | Exceptional 57.7% |
| Fijians | 98.4 /100 | #100 | Exceptional 57.6% |
| Lebanese | 98.3 /100 | #101 | Exceptional 57.6% |
| Immigrants | Bolivia | 98.2 /100 | #102 | Exceptional 57.6% |
| Jordanians | 98.2 /100 | #103 | Exceptional 57.6% |
| Immigrants | Indonesia | 98.2 /100 | #104 | Exceptional 57.6% |
| Immigrants | Korea | 98.2 /100 | #105 | Exceptional 57.6% |
| Immigrants | Oceania | 98.2 /100 | #106 | Exceptional 57.5% |
| Immigrants | Netherlands | 98.2 /100 | #107 | Exceptional 57.5% |
| Immigrants | Canada | 98.1 /100 | #108 | Exceptional 57.5% |
| Immigrants | North America | 98.1 /100 | #109 | Exceptional 57.5% |
| Japanese | 98.0 /100 | #110 | Exceptional 57.5% |
| Greeks | 98.0 /100 | #111 | Exceptional 57.5% |
| Pueblo | 98.0 /100 | #112 | Exceptional 57.5% |
| Zimbabweans | 96.9 /100 | #113 | Exceptional 57.2% |