Yugoslavian vs Comanche Family Poverty
COMPARE
Yugoslavian
Comanche
Family Poverty
Family Poverty Comparison
Yugoslavians
Comanche
8.5%
FAMILY POVERTY
83.5/ 100
METRIC RATING
142nd/ 347
METRIC RANK
11.0%
FAMILY POVERTY
0.1/ 100
METRIC RATING
267th/ 347
METRIC RANK
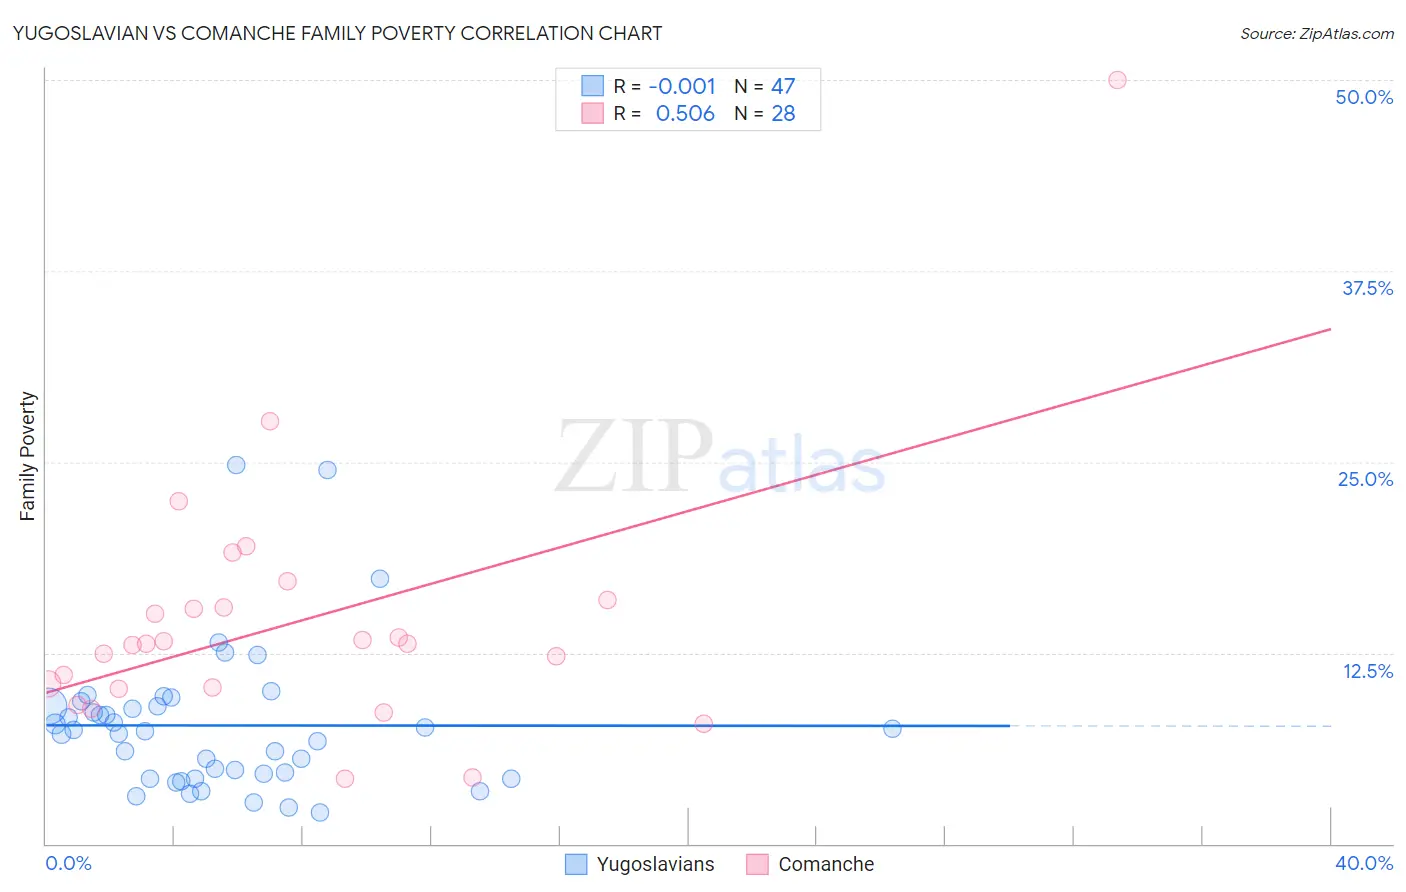
Yugoslavian vs Comanche Family Poverty Correlation Chart
The statistical analysis conducted on geographies consisting of 285,303,830 people shows no correlation between the proportion of Yugoslavians and poverty level among families in the United States with a correlation coefficient (R) of -0.001 and weighted average of 8.5%. Similarly, the statistical analysis conducted on geographies consisting of 109,722,823 people shows a substantial positive correlation between the proportion of Comanche and poverty level among families in the United States with a correlation coefficient (R) of 0.506 and weighted average of 11.0%, a difference of 29.5%.
Family Poverty Correlation Summary
| Measurement | Yugoslavian | Comanche |
| Minimum | 2.1% | 4.3% |
| Maximum | 24.8% | 50.0% |
| Range | 22.7% | 45.7% |
| Mean | 7.7% | 14.5% |
| Median | 7.3% | 13.1% |
| Interquartile 25% (IQ1) | 4.3% | 10.2% |
| Interquartile 75% (IQ3) | 9.0% | 15.7% |
| Interquartile Range (IQR) | 4.8% | 5.5% |
| Standard Deviation (Sample) | 4.8% | 8.6% |
| Standard Deviation (Population) | 4.7% | 8.4% |
Similar Demographics by Family Poverty
Demographics Similar to Yugoslavians by Family Poverty
In terms of family poverty, the demographic groups most similar to Yugoslavians are Immigrants from Germany (8.5%, a difference of 0.030%), Albanian (8.5%, a difference of 0.050%), Immigrants from South Eastern Asia (8.5%, a difference of 0.070%), Immigrants from Belarus (8.5%, a difference of 0.080%), and Immigrants from Ukraine (8.5%, a difference of 0.11%).
| Demographics | Rating | Rank | Family Poverty |
| Immigrants | Malaysia | 86.5 /100 | #135 | Excellent 8.5% |
| Immigrants | Brazil | 86.3 /100 | #136 | Excellent 8.5% |
| Immigrants | Southern Europe | 86.0 /100 | #137 | Excellent 8.5% |
| Armenians | 84.6 /100 | #138 | Excellent 8.5% |
| Immigrants | Nepal | 84.2 /100 | #139 | Excellent 8.5% |
| Immigrants | Kazakhstan | 84.1 /100 | #140 | Excellent 8.5% |
| Immigrants | Ukraine | 83.9 /100 | #141 | Excellent 8.5% |
| Yugoslavians | 83.5 /100 | #142 | Excellent 8.5% |
| Immigrants | Germany | 83.3 /100 | #143 | Excellent 8.5% |
| Albanians | 83.3 /100 | #144 | Excellent 8.5% |
| Immigrants | South Eastern Asia | 83.2 /100 | #145 | Excellent 8.5% |
| Immigrants | Belarus | 83.2 /100 | #146 | Excellent 8.5% |
| Immigrants | Jordan | 83.0 /100 | #147 | Excellent 8.5% |
| Scotch-Irish | 82.2 /100 | #148 | Excellent 8.6% |
| Mongolians | 80.4 /100 | #149 | Excellent 8.6% |
Demographics Similar to Comanche by Family Poverty
In terms of family poverty, the demographic groups most similar to Comanche are Immigrants from El Salvador (11.0%, a difference of 0.010%), Jamaican (11.1%, a difference of 0.10%), Immigrants from Ecuador (11.1%, a difference of 0.58%), Immigrants from Nicaragua (11.1%, a difference of 0.59%), and Immigrants from Bahamas (11.1%, a difference of 0.84%).
| Demographics | Rating | Rank | Family Poverty |
| Bangladeshis | 0.2 /100 | #260 | Tragic 10.9% |
| Shoshone | 0.2 /100 | #261 | Tragic 10.9% |
| Spanish American Indians | 0.2 /100 | #262 | Tragic 10.9% |
| Cape Verdeans | 0.1 /100 | #263 | Tragic 10.9% |
| Trinidadians and Tobagonians | 0.1 /100 | #264 | Tragic 10.9% |
| Immigrants | Trinidad and Tobago | 0.1 /100 | #265 | Tragic 10.9% |
| Immigrants | El Salvador | 0.1 /100 | #266 | Tragic 11.0% |
| Comanche | 0.1 /100 | #267 | Tragic 11.0% |
| Jamaicans | 0.1 /100 | #268 | Tragic 11.1% |
| Immigrants | Ecuador | 0.1 /100 | #269 | Tragic 11.1% |
| Immigrants | Nicaragua | 0.1 /100 | #270 | Tragic 11.1% |
| Immigrants | Bahamas | 0.1 /100 | #271 | Tragic 11.1% |
| Immigrants | Jamaica | 0.1 /100 | #272 | Tragic 11.2% |
| Somalis | 0.1 /100 | #273 | Tragic 11.2% |
| Spanish Americans | 0.1 /100 | #274 | Tragic 11.2% |