Yugoslavian vs White/Caucasian Family Poverty
COMPARE
Yugoslavian
White/Caucasian
Family Poverty
Family Poverty Comparison
Yugoslavians
Whites/Caucasians
8.5%
FAMILY POVERTY
83.5/ 100
METRIC RATING
142nd/ 347
METRIC RANK
8.8%
FAMILY POVERTY
69.1/ 100
METRIC RATING
158th/ 347
METRIC RANK
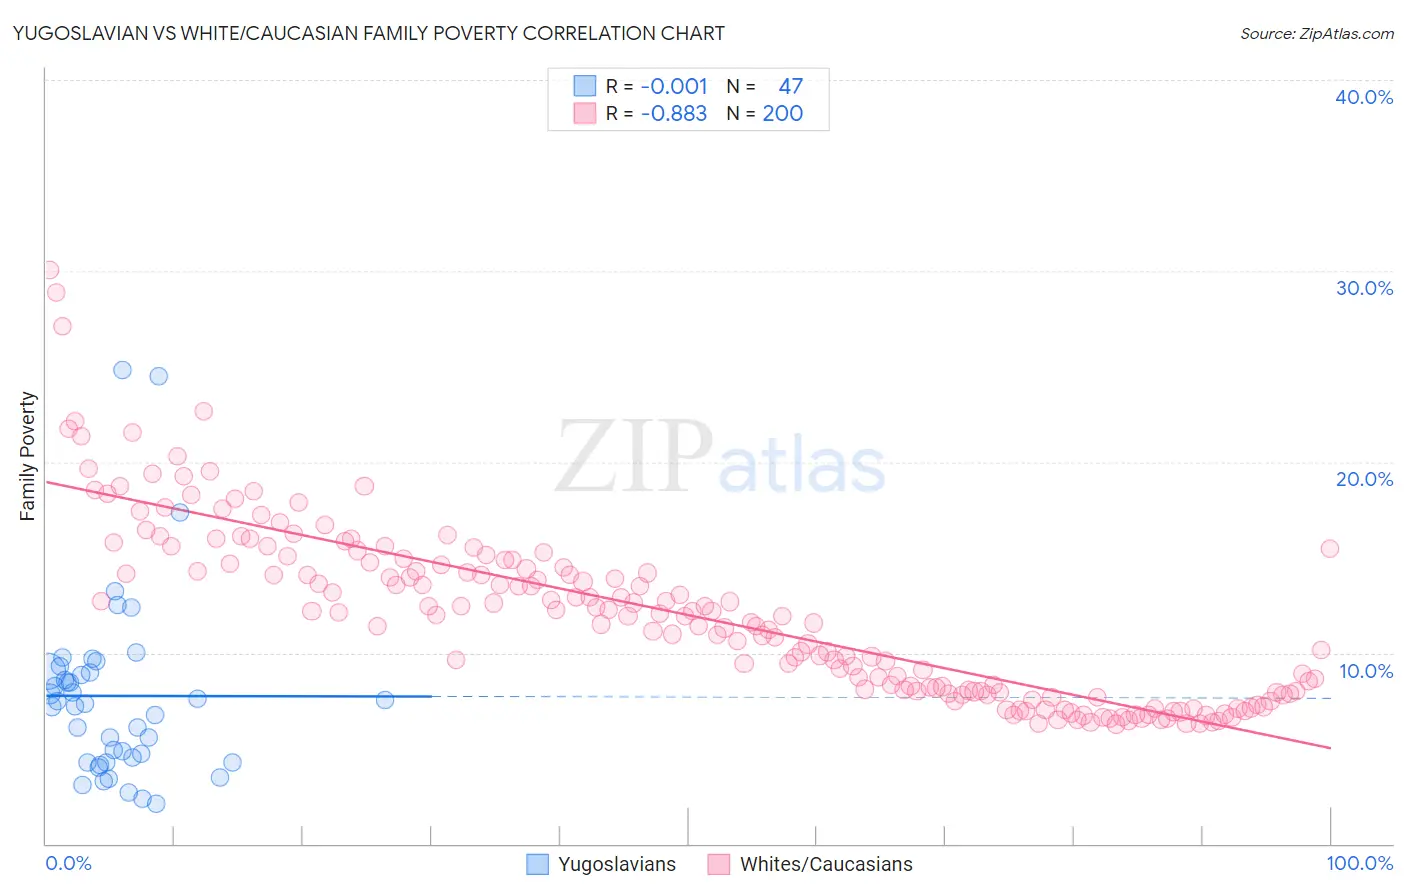
Yugoslavian vs White/Caucasian Family Poverty Correlation Chart
The statistical analysis conducted on geographies consisting of 285,303,830 people shows no correlation between the proportion of Yugoslavians and poverty level among families in the United States with a correlation coefficient (R) of -0.001 and weighted average of 8.5%. Similarly, the statistical analysis conducted on geographies consisting of 578,762,373 people shows a very strong negative correlation between the proportion of Whites/Caucasians and poverty level among families in the United States with a correlation coefficient (R) of -0.883 and weighted average of 8.8%, a difference of 2.8%.
Family Poverty Correlation Summary
| Measurement | Yugoslavian | White/Caucasian |
| Minimum | 2.1% | 6.3% |
| Maximum | 24.8% | 30.1% |
| Range | 22.7% | 23.8% |
| Mean | 7.7% | 12.0% |
| Median | 7.3% | 11.9% |
| Interquartile 25% (IQ1) | 4.3% | 7.9% |
| Interquartile 75% (IQ3) | 9.0% | 14.7% |
| Interquartile Range (IQR) | 4.8% | 6.7% |
| Standard Deviation (Sample) | 4.8% | 4.6% |
| Standard Deviation (Population) | 4.7% | 4.6% |
Demographics Similar to Yugoslavians and Whites/Caucasians by Family Poverty
In terms of family poverty, the demographic groups most similar to Yugoslavians are Immigrants from Germany (8.5%, a difference of 0.030%), Albanian (8.5%, a difference of 0.050%), Immigrants from South Eastern Asia (8.5%, a difference of 0.070%), Immigrants from Belarus (8.5%, a difference of 0.080%), and Immigrants from Ukraine (8.5%, a difference of 0.11%). Similarly, the demographic groups most similar to Whites/Caucasians are Tsimshian (8.8%, a difference of 0.040%), Peruvian (8.8%, a difference of 0.16%), Hungarian (8.8%, a difference of 0.30%), Immigrants from Oceania (8.7%, a difference of 0.34%), and Immigrants from Kuwait (8.7%, a difference of 0.74%).
| Demographics | Rating | Rank | Family Poverty |
| Immigrants | Kazakhstan | 84.1 /100 | #140 | Excellent 8.5% |
| Immigrants | Ukraine | 83.9 /100 | #141 | Excellent 8.5% |
| Yugoslavians | 83.5 /100 | #142 | Excellent 8.5% |
| Immigrants | Germany | 83.3 /100 | #143 | Excellent 8.5% |
| Albanians | 83.3 /100 | #144 | Excellent 8.5% |
| Immigrants | South Eastern Asia | 83.2 /100 | #145 | Excellent 8.5% |
| Immigrants | Belarus | 83.2 /100 | #146 | Excellent 8.5% |
| Immigrants | Jordan | 83.0 /100 | #147 | Excellent 8.5% |
| Scotch-Irish | 82.2 /100 | #148 | Excellent 8.6% |
| Mongolians | 80.4 /100 | #149 | Excellent 8.6% |
| Syrians | 80.3 /100 | #150 | Excellent 8.6% |
| Brazilians | 80.1 /100 | #151 | Excellent 8.6% |
| Samoans | 79.8 /100 | #152 | Good 8.6% |
| Immigrants | Spain | 79.1 /100 | #153 | Good 8.6% |
| Immigrants | Vietnam | 75.4 /100 | #154 | Good 8.7% |
| Immigrants | Kuwait | 73.6 /100 | #155 | Good 8.7% |
| Immigrants | Oceania | 71.2 /100 | #156 | Good 8.7% |
| Tsimshian | 69.3 /100 | #157 | Good 8.8% |
| Whites/Caucasians | 69.1 /100 | #158 | Good 8.8% |
| Peruvians | 68.0 /100 | #159 | Good 8.8% |
| Hungarians | 67.2 /100 | #160 | Good 8.8% |