Yaqui vs Dutch Married-Couple Family Poverty
COMPARE
Yaqui
Dutch
Married-Couple Family Poverty
Married-Couple Family Poverty Comparison
Yaqui
Dutch
6.3%
MARRIED-COUPLE FAMILY POVERTY
0.1/ 100
METRIC RATING
276th/ 347
METRIC RANK
4.2%
MARRIED-COUPLE FAMILY POVERTY
99.9/ 100
METRIC RATING
34th/ 347
METRIC RANK
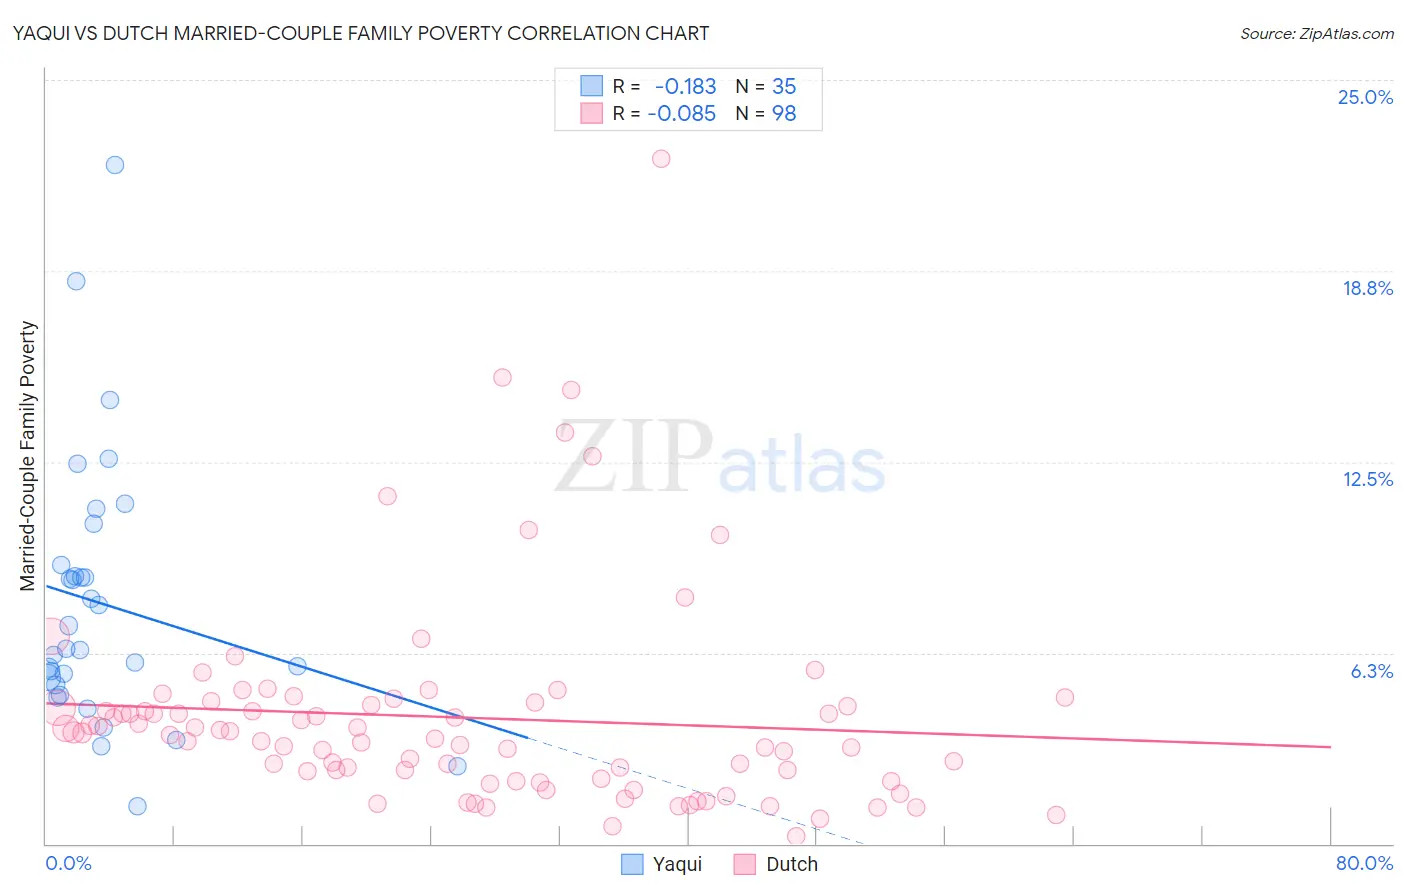
Yaqui vs Dutch Married-Couple Family Poverty Correlation Chart
The statistical analysis conducted on geographies consisting of 107,553,636 people shows a poor negative correlation between the proportion of Yaqui and poverty level among married-couple families in the United States with a correlation coefficient (R) of -0.183 and weighted average of 6.3%. Similarly, the statistical analysis conducted on geographies consisting of 541,561,341 people shows a slight negative correlation between the proportion of Dutch and poverty level among married-couple families in the United States with a correlation coefficient (R) of -0.085 and weighted average of 4.2%, a difference of 50.6%.
Married-Couple Family Poverty Correlation Summary
| Measurement | Yaqui | Dutch |
| Minimum | 1.2% | 0.25% |
| Maximum | 22.2% | 22.4% |
| Range | 21.0% | 22.2% |
| Mean | 7.9% | 4.1% |
| Median | 6.4% | 3.6% |
| Interquartile 25% (IQ1) | 5.2% | 2.1% |
| Interquartile 75% (IQ3) | 9.1% | 4.5% |
| Interquartile Range (IQR) | 3.9% | 2.4% |
| Standard Deviation (Sample) | 4.3% | 3.4% |
| Standard Deviation (Population) | 4.3% | 3.4% |
Similar Demographics by Married-Couple Family Poverty
Demographics Similar to Yaqui by Married-Couple Family Poverty
In terms of married-couple family poverty, the demographic groups most similar to Yaqui are Indonesian (6.3%, a difference of 0.14%), Choctaw (6.3%, a difference of 0.45%), Barbadian (6.3%, a difference of 0.62%), Immigrants from Trinidad and Tobago (6.4%, a difference of 0.62%), and Colville (6.3%, a difference of 0.66%).
| Demographics | Rating | Rank | Married-Couple Family Poverty |
| Immigrants | West Indies | 0.1 /100 | #269 | Tragic 6.2% |
| Immigrants | Jamaica | 0.1 /100 | #270 | Tragic 6.2% |
| Immigrants | Bahamas | 0.1 /100 | #271 | Tragic 6.2% |
| Trinidadians and Tobagonians | 0.1 /100 | #272 | Tragic 6.2% |
| Colville | 0.1 /100 | #273 | Tragic 6.3% |
| Barbadians | 0.1 /100 | #274 | Tragic 6.3% |
| Choctaw | 0.1 /100 | #275 | Tragic 6.3% |
| Yaqui | 0.1 /100 | #276 | Tragic 6.3% |
| Indonesians | 0.1 /100 | #277 | Tragic 6.3% |
| Immigrants | Trinidad and Tobago | 0.1 /100 | #278 | Tragic 6.4% |
| Houma | 0.0 /100 | #279 | Tragic 6.4% |
| West Indians | 0.0 /100 | #280 | Tragic 6.4% |
| Mexican American Indians | 0.0 /100 | #281 | Tragic 6.4% |
| Seminole | 0.0 /100 | #282 | Tragic 6.4% |
| Ute | 0.0 /100 | #283 | Tragic 6.4% |
Demographics Similar to Dutch by Married-Couple Family Poverty
In terms of married-couple family poverty, the demographic groups most similar to Dutch are Irish (4.2%, a difference of 0.23%), European (4.2%, a difference of 0.57%), English (4.2%, a difference of 0.60%), Iranian (4.2%, a difference of 0.67%), and Greek (4.2%, a difference of 0.71%).
| Demographics | Rating | Rank | Married-Couple Family Poverty |
| Danes | 99.9 /100 | #27 | Exceptional 4.1% |
| Scandinavians | 99.9 /100 | #28 | Exceptional 4.1% |
| Immigrants | Scotland | 99.9 /100 | #29 | Exceptional 4.2% |
| Finns | 99.9 /100 | #30 | Exceptional 4.2% |
| Estonians | 99.9 /100 | #31 | Exceptional 4.2% |
| Greeks | 99.9 /100 | #32 | Exceptional 4.2% |
| Irish | 99.9 /100 | #33 | Exceptional 4.2% |
| Dutch | 99.9 /100 | #34 | Exceptional 4.2% |
| Europeans | 99.9 /100 | #35 | Exceptional 4.2% |
| English | 99.9 /100 | #36 | Exceptional 4.2% |
| Iranians | 99.9 /100 | #37 | Exceptional 4.2% |
| Belgians | 99.9 /100 | #38 | Exceptional 4.2% |
| Immigrants | Northern Europe | 99.8 /100 | #39 | Exceptional 4.2% |
| French Canadians | 99.8 /100 | #40 | Exceptional 4.2% |
| Northern Europeans | 99.8 /100 | #41 | Exceptional 4.3% |