Yaqui vs Sioux Married-Couple Family Poverty
COMPARE
Yaqui
Sioux
Married-Couple Family Poverty
Married-Couple Family Poverty Comparison
Yaqui
Sioux
6.3%
MARRIED-COUPLE FAMILY POVERTY
0.1/ 100
METRIC RATING
276th/ 347
METRIC RANK
8.7%
MARRIED-COUPLE FAMILY POVERTY
0.0/ 100
METRIC RATING
335th/ 347
METRIC RANK
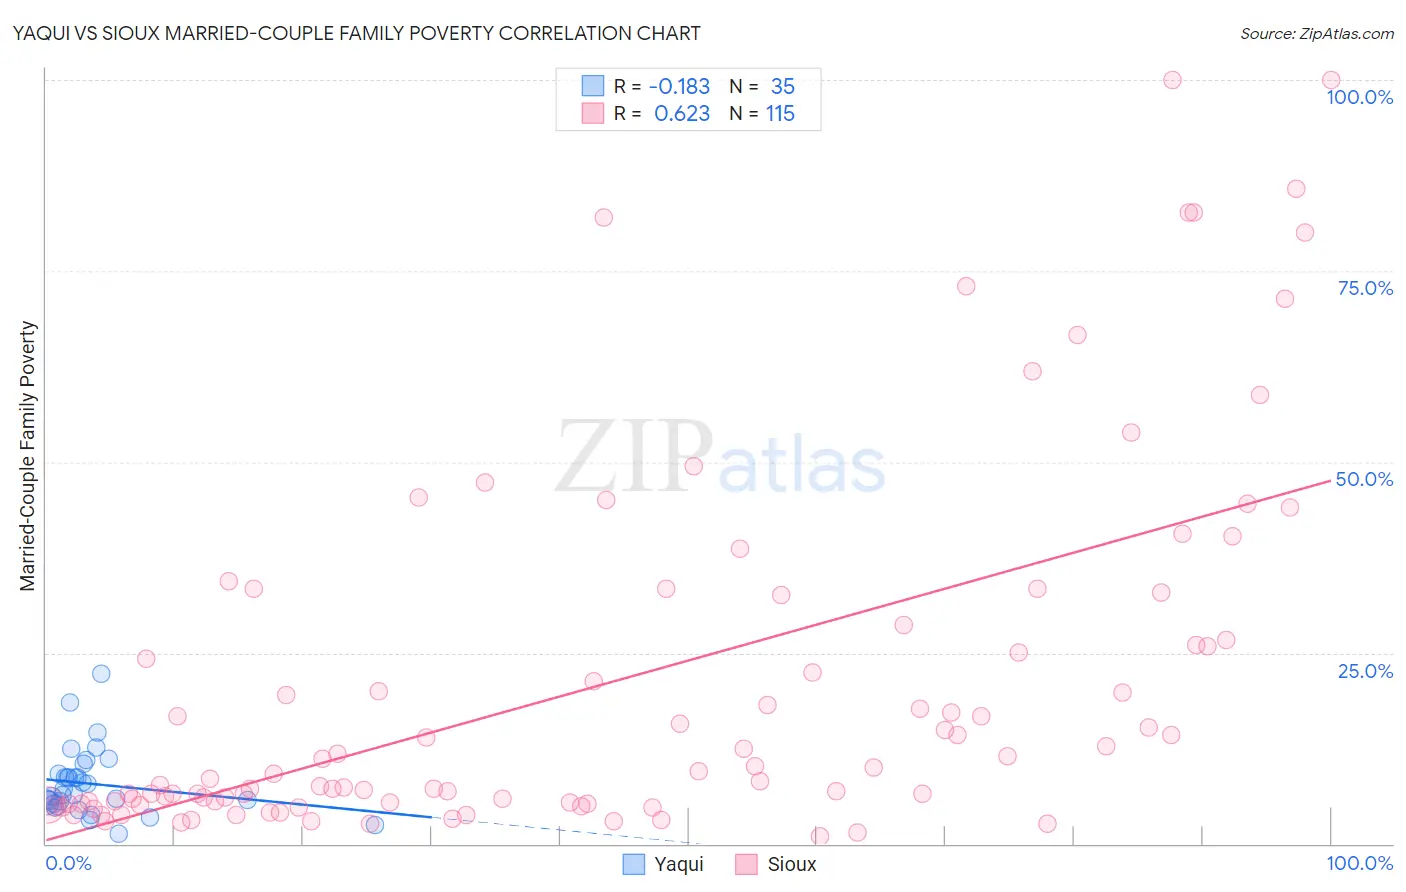
Yaqui vs Sioux Married-Couple Family Poverty Correlation Chart
The statistical analysis conducted on geographies consisting of 107,553,636 people shows a poor negative correlation between the proportion of Yaqui and poverty level among married-couple families in the United States with a correlation coefficient (R) of -0.183 and weighted average of 6.3%. Similarly, the statistical analysis conducted on geographies consisting of 232,751,965 people shows a significant positive correlation between the proportion of Sioux and poverty level among married-couple families in the United States with a correlation coefficient (R) of 0.623 and weighted average of 8.7%, a difference of 37.6%.
Married-Couple Family Poverty Correlation Summary
| Measurement | Yaqui | Sioux |
| Minimum | 1.2% | 0.94% |
| Maximum | 22.2% | 100.0% |
| Range | 21.0% | 99.1% |
| Mean | 7.9% | 21.0% |
| Median | 6.4% | 9.4% |
| Interquartile 25% (IQ1) | 5.2% | 5.3% |
| Interquartile 75% (IQ3) | 9.1% | 28.6% |
| Interquartile Range (IQR) | 3.9% | 23.3% |
| Standard Deviation (Sample) | 4.3% | 23.8% |
| Standard Deviation (Population) | 4.3% | 23.7% |
Similar Demographics by Married-Couple Family Poverty
Demographics Similar to Yaqui by Married-Couple Family Poverty
In terms of married-couple family poverty, the demographic groups most similar to Yaqui are Indonesian (6.3%, a difference of 0.14%), Choctaw (6.3%, a difference of 0.45%), Barbadian (6.3%, a difference of 0.62%), Immigrants from Trinidad and Tobago (6.4%, a difference of 0.62%), and Colville (6.3%, a difference of 0.66%).
| Demographics | Rating | Rank | Married-Couple Family Poverty |
| Immigrants | West Indies | 0.1 /100 | #269 | Tragic 6.2% |
| Immigrants | Jamaica | 0.1 /100 | #270 | Tragic 6.2% |
| Immigrants | Bahamas | 0.1 /100 | #271 | Tragic 6.2% |
| Trinidadians and Tobagonians | 0.1 /100 | #272 | Tragic 6.2% |
| Colville | 0.1 /100 | #273 | Tragic 6.3% |
| Barbadians | 0.1 /100 | #274 | Tragic 6.3% |
| Choctaw | 0.1 /100 | #275 | Tragic 6.3% |
| Yaqui | 0.1 /100 | #276 | Tragic 6.3% |
| Indonesians | 0.1 /100 | #277 | Tragic 6.3% |
| Immigrants | Trinidad and Tobago | 0.1 /100 | #278 | Tragic 6.4% |
| Houma | 0.0 /100 | #279 | Tragic 6.4% |
| West Indians | 0.0 /100 | #280 | Tragic 6.4% |
| Mexican American Indians | 0.0 /100 | #281 | Tragic 6.4% |
| Seminole | 0.0 /100 | #282 | Tragic 6.4% |
| Ute | 0.0 /100 | #283 | Tragic 6.4% |
Demographics Similar to Sioux by Married-Couple Family Poverty
In terms of married-couple family poverty, the demographic groups most similar to Sioux are Apache (9.0%, a difference of 2.9%), Yakama (9.0%, a difference of 3.0%), Immigrants from Dominican Republic (8.4%, a difference of 3.6%), Lumbee (8.3%, a difference of 4.3%), and Dominican (8.3%, a difference of 4.8%).
| Demographics | Rating | Rank | Married-Couple Family Poverty |
| Immigrants | Mexico | 0.0 /100 | #328 | Tragic 7.6% |
| Natives/Alaskans | 0.0 /100 | #329 | Tragic 8.2% |
| Paiute | 0.0 /100 | #330 | Tragic 8.3% |
| Central American Indians | 0.0 /100 | #331 | Tragic 8.3% |
| Dominicans | 0.0 /100 | #332 | Tragic 8.3% |
| Lumbee | 0.0 /100 | #333 | Tragic 8.3% |
| Immigrants | Dominican Republic | 0.0 /100 | #334 | Tragic 8.4% |
| Sioux | 0.0 /100 | #335 | Tragic 8.7% |
| Apache | 0.0 /100 | #336 | Tragic 9.0% |
| Yakama | 0.0 /100 | #337 | Tragic 9.0% |
| Cheyenne | 0.0 /100 | #338 | Tragic 9.4% |
| Crow | 0.0 /100 | #339 | Tragic 9.6% |
| Yuman | 0.0 /100 | #340 | Tragic 9.7% |
| Pueblo | 0.0 /100 | #341 | Tragic 11.1% |
| Tohono O'odham | 0.0 /100 | #342 | Tragic 11.2% |