Argentinean vs Dutch Married-Couple Family Poverty
COMPARE
Argentinean
Dutch
Married-Couple Family Poverty
Married-Couple Family Poverty Comparison
Argentineans
Dutch
5.1%
MARRIED-COUPLE FAMILY POVERTY
70.7/ 100
METRIC RATING
157th/ 347
METRIC RANK
4.2%
MARRIED-COUPLE FAMILY POVERTY
99.9/ 100
METRIC RATING
34th/ 347
METRIC RANK
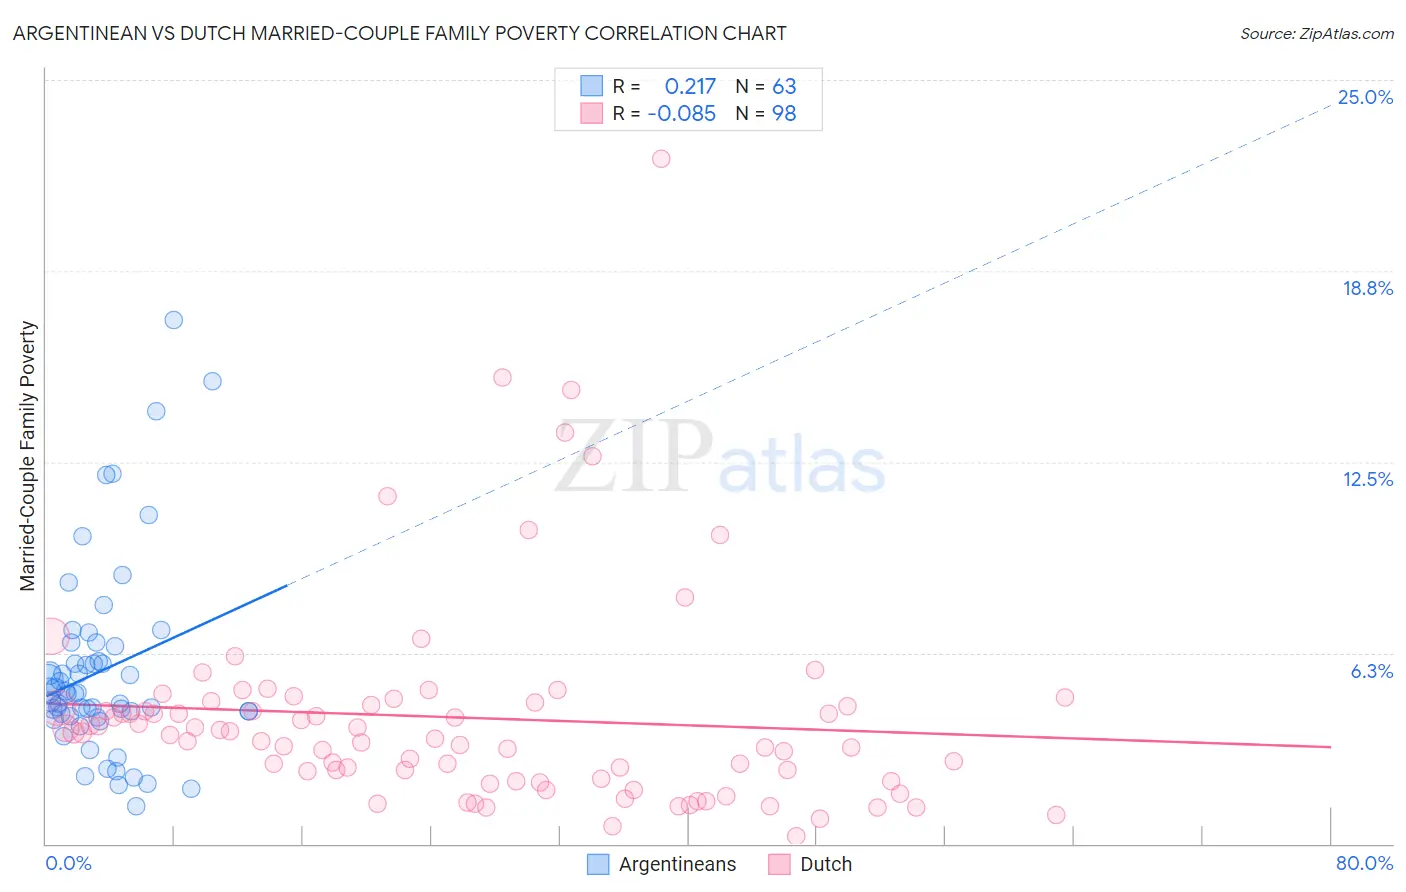
Argentinean vs Dutch Married-Couple Family Poverty Correlation Chart
The statistical analysis conducted on geographies consisting of 295,403,165 people shows a weak positive correlation between the proportion of Argentineans and poverty level among married-couple families in the United States with a correlation coefficient (R) of 0.217 and weighted average of 5.1%. Similarly, the statistical analysis conducted on geographies consisting of 541,561,341 people shows a slight negative correlation between the proportion of Dutch and poverty level among married-couple families in the United States with a correlation coefficient (R) of -0.085 and weighted average of 4.2%, a difference of 21.1%.
Married-Couple Family Poverty Correlation Summary
| Measurement | Argentinean | Dutch |
| Minimum | 1.2% | 0.25% |
| Maximum | 17.1% | 22.4% |
| Range | 15.9% | 22.2% |
| Mean | 5.7% | 4.1% |
| Median | 4.9% | 3.6% |
| Interquartile 25% (IQ1) | 4.2% | 2.1% |
| Interquartile 75% (IQ3) | 6.5% | 4.5% |
| Interquartile Range (IQR) | 2.3% | 2.4% |
| Standard Deviation (Sample) | 3.2% | 3.4% |
| Standard Deviation (Population) | 3.1% | 3.4% |
Similar Demographics by Married-Couple Family Poverty
Demographics Similar to Argentineans by Married-Couple Family Poverty
In terms of married-couple family poverty, the demographic groups most similar to Argentineans are Immigrants from South Eastern Asia (5.1%, a difference of 0.050%), Immigrants from Saudi Arabia (5.1%, a difference of 0.050%), Sri Lankan (5.1%, a difference of 0.22%), Immigrants from Ethiopia (5.1%, a difference of 0.26%), and Pennsylvania German (5.1%, a difference of 0.30%).
| Demographics | Rating | Rank | Married-Couple Family Poverty |
| Brazilians | 78.3 /100 | #150 | Good 5.0% |
| Immigrants | Cameroon | 77.3 /100 | #151 | Good 5.0% |
| Albanians | 77.2 /100 | #152 | Good 5.0% |
| Immigrants | Kuwait | 76.3 /100 | #153 | Good 5.0% |
| Delaware | 73.7 /100 | #154 | Good 5.1% |
| Immigrants | Ethiopia | 72.4 /100 | #155 | Good 5.1% |
| Sri Lankans | 72.2 /100 | #156 | Good 5.1% |
| Argentineans | 70.7 /100 | #157 | Good 5.1% |
| Immigrants | South Eastern Asia | 70.4 /100 | #158 | Good 5.1% |
| Immigrants | Saudi Arabia | 70.3 /100 | #159 | Good 5.1% |
| Pennsylvania Germans | 68.5 /100 | #160 | Good 5.1% |
| Ethiopians | 68.1 /100 | #161 | Good 5.1% |
| Immigrants | Jordan | 66.5 /100 | #162 | Good 5.1% |
| Sierra Leoneans | 64.1 /100 | #163 | Good 5.1% |
| Hawaiians | 62.3 /100 | #164 | Good 5.1% |
Demographics Similar to Dutch by Married-Couple Family Poverty
In terms of married-couple family poverty, the demographic groups most similar to Dutch are Irish (4.2%, a difference of 0.23%), European (4.2%, a difference of 0.57%), English (4.2%, a difference of 0.60%), Iranian (4.2%, a difference of 0.67%), and Greek (4.2%, a difference of 0.71%).
| Demographics | Rating | Rank | Married-Couple Family Poverty |
| Danes | 99.9 /100 | #27 | Exceptional 4.1% |
| Scandinavians | 99.9 /100 | #28 | Exceptional 4.1% |
| Immigrants | Scotland | 99.9 /100 | #29 | Exceptional 4.2% |
| Finns | 99.9 /100 | #30 | Exceptional 4.2% |
| Estonians | 99.9 /100 | #31 | Exceptional 4.2% |
| Greeks | 99.9 /100 | #32 | Exceptional 4.2% |
| Irish | 99.9 /100 | #33 | Exceptional 4.2% |
| Dutch | 99.9 /100 | #34 | Exceptional 4.2% |
| Europeans | 99.9 /100 | #35 | Exceptional 4.2% |
| English | 99.9 /100 | #36 | Exceptional 4.2% |
| Iranians | 99.9 /100 | #37 | Exceptional 4.2% |
| Belgians | 99.9 /100 | #38 | Exceptional 4.2% |
| Immigrants | Northern Europe | 99.8 /100 | #39 | Exceptional 4.2% |
| French Canadians | 99.8 /100 | #40 | Exceptional 4.2% |
| Northern Europeans | 99.8 /100 | #41 | Exceptional 4.3% |