Immigrants from Bulgaria vs Dutch Married-Couple Family Poverty
COMPARE
Immigrants from Bulgaria
Dutch
Married-Couple Family Poverty
Married-Couple Family Poverty Comparison
Immigrants from Bulgaria
Dutch
4.4%
MARRIED-COUPLE FAMILY POVERTY
99.5/ 100
METRIC RATING
64th/ 347
METRIC RANK
4.2%
MARRIED-COUPLE FAMILY POVERTY
99.9/ 100
METRIC RATING
34th/ 347
METRIC RANK
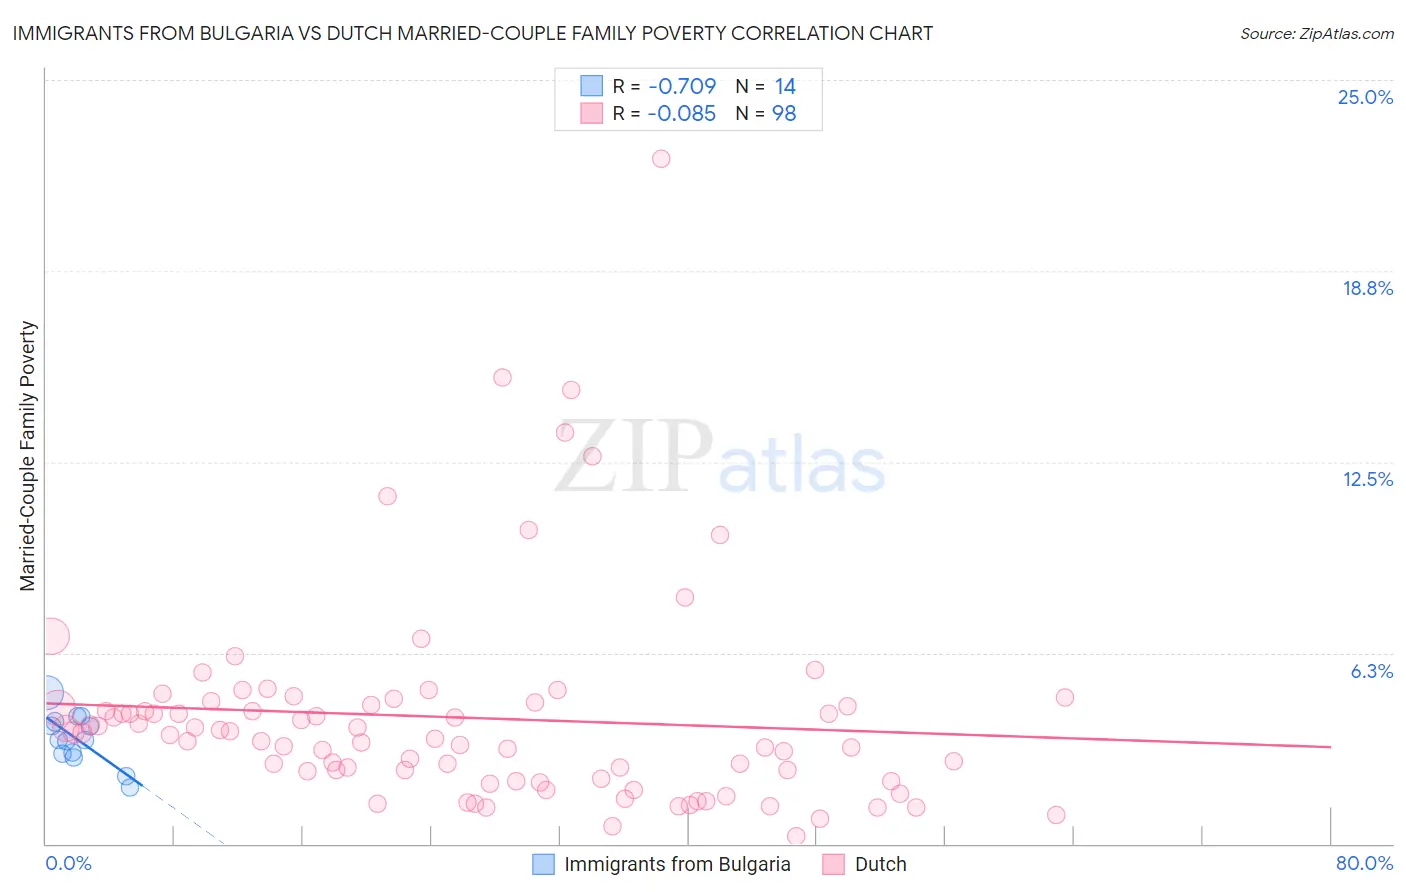
Immigrants from Bulgaria vs Dutch Married-Couple Family Poverty Correlation Chart
The statistical analysis conducted on geographies consisting of 171,925,932 people shows a strong negative correlation between the proportion of Immigrants from Bulgaria and poverty level among married-couple families in the United States with a correlation coefficient (R) of -0.709 and weighted average of 4.4%. Similarly, the statistical analysis conducted on geographies consisting of 541,561,341 people shows a slight negative correlation between the proportion of Dutch and poverty level among married-couple families in the United States with a correlation coefficient (R) of -0.085 and weighted average of 4.2%, a difference of 5.2%.
Married-Couple Family Poverty Correlation Summary
| Measurement | Immigrants from Bulgaria | Dutch |
| Minimum | 1.9% | 0.25% |
| Maximum | 4.9% | 22.4% |
| Range | 3.1% | 22.2% |
| Mean | 3.4% | 4.1% |
| Median | 3.4% | 3.6% |
| Interquartile 25% (IQ1) | 2.9% | 2.1% |
| Interquartile 75% (IQ3) | 4.0% | 4.5% |
| Interquartile Range (IQR) | 1.1% | 2.4% |
| Standard Deviation (Sample) | 0.83% | 3.4% |
| Standard Deviation (Population) | 0.80% | 3.4% |
Similar Demographics by Married-Couple Family Poverty
Demographics Similar to Immigrants from Bulgaria by Married-Couple Family Poverty
In terms of married-couple family poverty, the demographic groups most similar to Immigrants from Bulgaria are Immigrants from Sri Lanka (4.4%, a difference of 0.41%), Macedonian (4.4%, a difference of 0.47%), Immigrants from Serbia (4.4%, a difference of 0.60%), Immigrants from Canada (4.4%, a difference of 0.65%), and Slavic (4.4%, a difference of 0.66%).
| Demographics | Rating | Rank | Married-Couple Family Poverty |
| Immigrants | Netherlands | 99.7 /100 | #57 | Exceptional 4.3% |
| Czechoslovakians | 99.7 /100 | #58 | Exceptional 4.4% |
| Immigrants | Sweden | 99.6 /100 | #59 | Exceptional 4.4% |
| Tlingit-Haida | 99.6 /100 | #60 | Exceptional 4.4% |
| Okinawans | 99.6 /100 | #61 | Exceptional 4.4% |
| Immigrants | Australia | 99.6 /100 | #62 | Exceptional 4.4% |
| Immigrants | Sri Lanka | 99.6 /100 | #63 | Exceptional 4.4% |
| Immigrants | Bulgaria | 99.5 /100 | #64 | Exceptional 4.4% |
| Macedonians | 99.4 /100 | #65 | Exceptional 4.4% |
| Immigrants | Serbia | 99.4 /100 | #66 | Exceptional 4.4% |
| Immigrants | Canada | 99.4 /100 | #67 | Exceptional 4.4% |
| Slavs | 99.4 /100 | #68 | Exceptional 4.4% |
| New Zealanders | 99.4 /100 | #69 | Exceptional 4.4% |
| Immigrants | Korea | 99.4 /100 | #70 | Exceptional 4.5% |
| Immigrants | North America | 99.3 /100 | #71 | Exceptional 4.5% |
Demographics Similar to Dutch by Married-Couple Family Poverty
In terms of married-couple family poverty, the demographic groups most similar to Dutch are Irish (4.2%, a difference of 0.23%), European (4.2%, a difference of 0.57%), English (4.2%, a difference of 0.60%), Iranian (4.2%, a difference of 0.67%), and Greek (4.2%, a difference of 0.71%).
| Demographics | Rating | Rank | Married-Couple Family Poverty |
| Danes | 99.9 /100 | #27 | Exceptional 4.1% |
| Scandinavians | 99.9 /100 | #28 | Exceptional 4.1% |
| Immigrants | Scotland | 99.9 /100 | #29 | Exceptional 4.2% |
| Finns | 99.9 /100 | #30 | Exceptional 4.2% |
| Estonians | 99.9 /100 | #31 | Exceptional 4.2% |
| Greeks | 99.9 /100 | #32 | Exceptional 4.2% |
| Irish | 99.9 /100 | #33 | Exceptional 4.2% |
| Dutch | 99.9 /100 | #34 | Exceptional 4.2% |
| Europeans | 99.9 /100 | #35 | Exceptional 4.2% |
| English | 99.9 /100 | #36 | Exceptional 4.2% |
| Iranians | 99.9 /100 | #37 | Exceptional 4.2% |
| Belgians | 99.9 /100 | #38 | Exceptional 4.2% |
| Immigrants | Northern Europe | 99.8 /100 | #39 | Exceptional 4.2% |
| French Canadians | 99.8 /100 | #40 | Exceptional 4.2% |
| Northern Europeans | 99.8 /100 | #41 | Exceptional 4.3% |