Trinidadian and Tobagonian vs Turkish Married-Couple Family Poverty
COMPARE
Trinidadian and Tobagonian
Turkish
Married-Couple Family Poverty
Married-Couple Family Poverty Comparison
Trinidadians and Tobagonians
Turks
6.2%
MARRIED-COUPLE FAMILY POVERTY
0.1/ 100
METRIC RATING
272nd/ 347
METRIC RANK
4.3%
MARRIED-COUPLE FAMILY POVERTY
99.7/ 100
METRIC RATING
49th/ 347
METRIC RANK
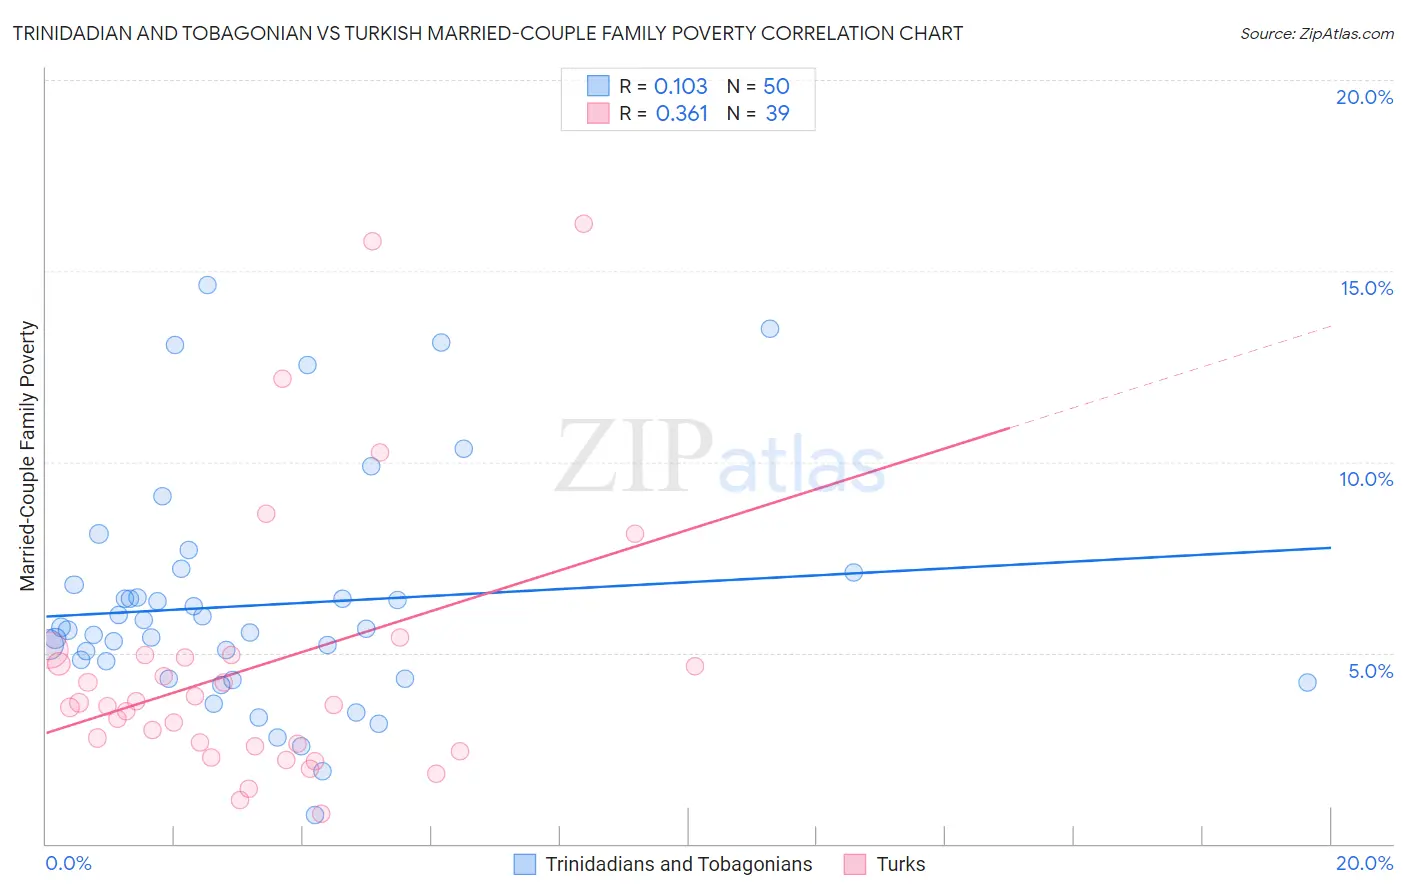
Trinidadian and Tobagonian vs Turkish Married-Couple Family Poverty Correlation Chart
The statistical analysis conducted on geographies consisting of 218,634,387 people shows a poor positive correlation between the proportion of Trinidadians and Tobagonians and poverty level among married-couple families in the United States with a correlation coefficient (R) of 0.103 and weighted average of 6.2%. Similarly, the statistical analysis conducted on geographies consisting of 270,078,353 people shows a mild positive correlation between the proportion of Turks and poverty level among married-couple families in the United States with a correlation coefficient (R) of 0.361 and weighted average of 4.3%, a difference of 44.4%.
Married-Couple Family Poverty Correlation Summary
| Measurement | Trinidadian and Tobagonian | Turkish |
| Minimum | 0.75% | 0.78% |
| Maximum | 14.6% | 16.2% |
| Range | 13.9% | 15.5% |
| Mean | 6.3% | 4.6% |
| Median | 5.6% | 3.6% |
| Interquartile 25% (IQ1) | 4.3% | 2.6% |
| Interquartile 75% (IQ3) | 6.8% | 4.9% |
| Interquartile Range (IQR) | 2.4% | 2.4% |
| Standard Deviation (Sample) | 3.0% | 3.6% |
| Standard Deviation (Population) | 3.0% | 3.5% |
Similar Demographics by Married-Couple Family Poverty
Demographics Similar to Trinidadians and Tobagonians by Married-Couple Family Poverty
In terms of married-couple family poverty, the demographic groups most similar to Trinidadians and Tobagonians are Immigrants from Bahamas (6.2%, a difference of 0.030%), Immigrants from Jamaica (6.2%, a difference of 0.25%), Immigrants from West Indies (6.2%, a difference of 0.29%), Alaska Native (6.2%, a difference of 0.46%), and Colville (6.3%, a difference of 0.78%).
| Demographics | Rating | Rank | Married-Couple Family Poverty |
| Blackfeet | 0.2 /100 | #265 | Tragic 6.2% |
| Creek | 0.2 /100 | #266 | Tragic 6.2% |
| Spanish Americans | 0.2 /100 | #267 | Tragic 6.2% |
| Alaska Natives | 0.2 /100 | #268 | Tragic 6.2% |
| Immigrants | West Indies | 0.1 /100 | #269 | Tragic 6.2% |
| Immigrants | Jamaica | 0.1 /100 | #270 | Tragic 6.2% |
| Immigrants | Bahamas | 0.1 /100 | #271 | Tragic 6.2% |
| Trinidadians and Tobagonians | 0.1 /100 | #272 | Tragic 6.2% |
| Colville | 0.1 /100 | #273 | Tragic 6.3% |
| Barbadians | 0.1 /100 | #274 | Tragic 6.3% |
| Choctaw | 0.1 /100 | #275 | Tragic 6.3% |
| Yaqui | 0.1 /100 | #276 | Tragic 6.3% |
| Indonesians | 0.1 /100 | #277 | Tragic 6.3% |
| Immigrants | Trinidad and Tobago | 0.1 /100 | #278 | Tragic 6.4% |
| Houma | 0.0 /100 | #279 | Tragic 6.4% |
Demographics Similar to Turks by Married-Couple Family Poverty
In terms of married-couple family poverty, the demographic groups most similar to Turks are Australian (4.3%, a difference of 0.080%), Burmese (4.3%, a difference of 0.10%), Immigrants from Lithuania (4.3%, a difference of 0.11%), Russian (4.3%, a difference of 0.13%), and Immigrants from South Central Asia (4.3%, a difference of 0.15%).
| Demographics | Rating | Rank | Married-Couple Family Poverty |
| Scottish | 99.8 /100 | #42 | Exceptional 4.3% |
| Swiss | 99.8 /100 | #43 | Exceptional 4.3% |
| Immigrants | Japan | 99.8 /100 | #44 | Exceptional 4.3% |
| Serbians | 99.8 /100 | #45 | Exceptional 4.3% |
| British | 99.8 /100 | #46 | Exceptional 4.3% |
| Immigrants | South Central Asia | 99.8 /100 | #47 | Exceptional 4.3% |
| Australians | 99.7 /100 | #48 | Exceptional 4.3% |
| Turks | 99.7 /100 | #49 | Exceptional 4.3% |
| Burmese | 99.7 /100 | #50 | Exceptional 4.3% |
| Immigrants | Lithuania | 99.7 /100 | #51 | Exceptional 4.3% |
| Russians | 99.7 /100 | #52 | Exceptional 4.3% |
| Welsh | 99.7 /100 | #53 | Exceptional 4.3% |
| Austrians | 99.7 /100 | #54 | Exceptional 4.3% |
| French | 99.7 /100 | #55 | Exceptional 4.3% |
| Immigrants | Zimbabwe | 99.7 /100 | #56 | Exceptional 4.3% |