Trinidadian and Tobagonian vs Immigrants from Moldova Married-Couple Family Poverty
COMPARE
Trinidadian and Tobagonian
Immigrants from Moldova
Married-Couple Family Poverty
Married-Couple Family Poverty Comparison
Trinidadians and Tobagonians
Immigrants from Moldova
6.2%
MARRIED-COUPLE FAMILY POVERTY
0.1/ 100
METRIC RATING
272nd/ 347
METRIC RANK
4.7%
MARRIED-COUPLE FAMILY POVERTY
97.1/ 100
METRIC RATING
104th/ 347
METRIC RANK
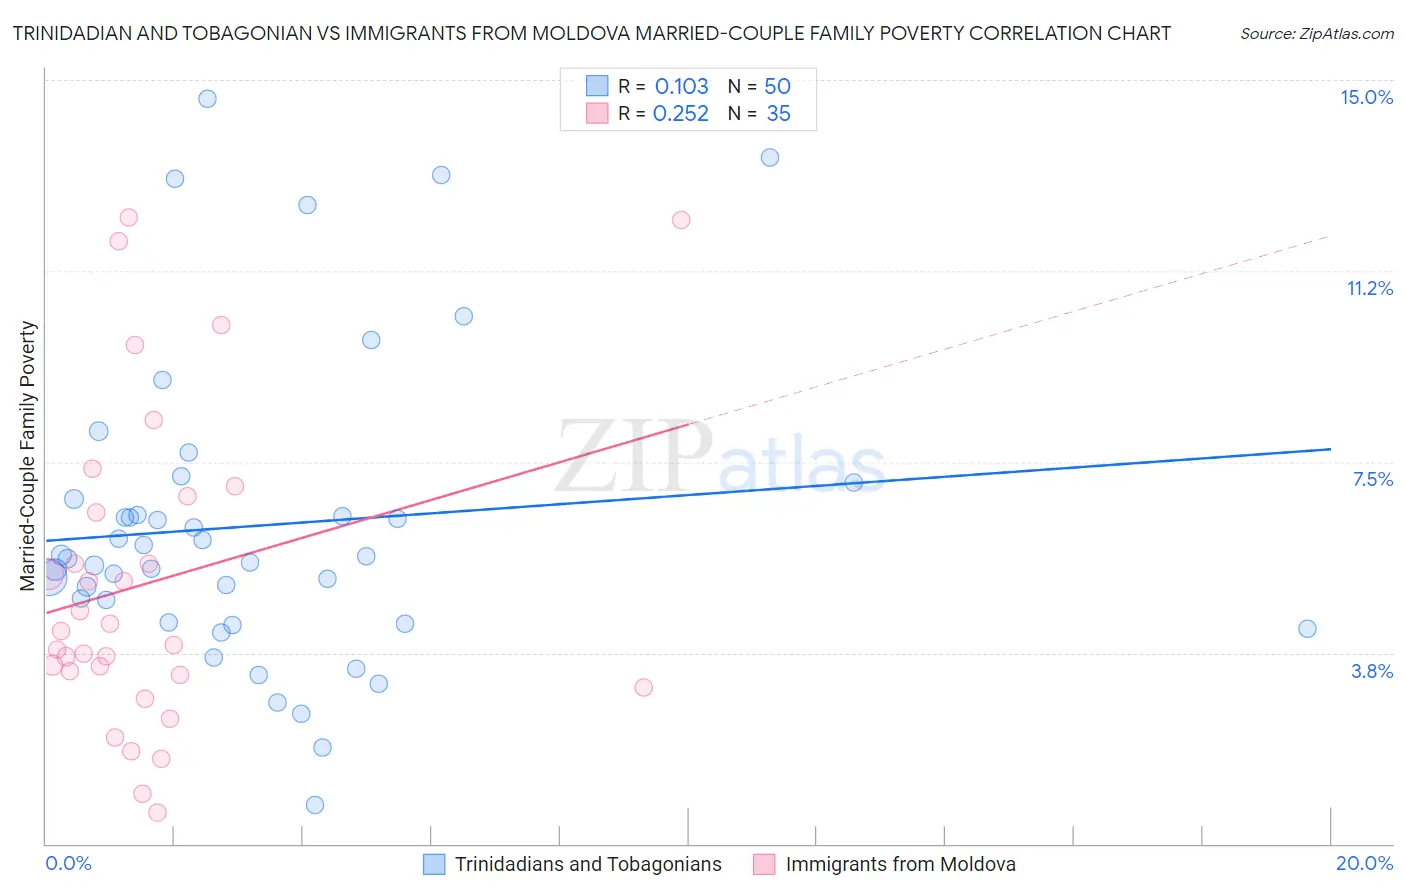
Trinidadian and Tobagonian vs Immigrants from Moldova Married-Couple Family Poverty Correlation Chart
The statistical analysis conducted on geographies consisting of 218,634,387 people shows a poor positive correlation between the proportion of Trinidadians and Tobagonians and poverty level among married-couple families in the United States with a correlation coefficient (R) of 0.103 and weighted average of 6.2%. Similarly, the statistical analysis conducted on geographies consisting of 124,083,541 people shows a weak positive correlation between the proportion of Immigrants from Moldova and poverty level among married-couple families in the United States with a correlation coefficient (R) of 0.252 and weighted average of 4.7%, a difference of 32.9%.
Married-Couple Family Poverty Correlation Summary
| Measurement | Trinidadian and Tobagonian | Immigrants from Moldova |
| Minimum | 0.75% | 0.62% |
| Maximum | 14.6% | 12.3% |
| Range | 13.9% | 11.7% |
| Mean | 6.3% | 5.1% |
| Median | 5.6% | 4.2% |
| Interquartile 25% (IQ1) | 4.3% | 3.3% |
| Interquartile 75% (IQ3) | 6.8% | 6.8% |
| Interquartile Range (IQR) | 2.4% | 3.5% |
| Standard Deviation (Sample) | 3.0% | 3.1% |
| Standard Deviation (Population) | 3.0% | 3.1% |
Similar Demographics by Married-Couple Family Poverty
Demographics Similar to Trinidadians and Tobagonians by Married-Couple Family Poverty
In terms of married-couple family poverty, the demographic groups most similar to Trinidadians and Tobagonians are Immigrants from Bahamas (6.2%, a difference of 0.030%), Immigrants from Jamaica (6.2%, a difference of 0.25%), Immigrants from West Indies (6.2%, a difference of 0.29%), Alaska Native (6.2%, a difference of 0.46%), and Colville (6.3%, a difference of 0.78%).
| Demographics | Rating | Rank | Married-Couple Family Poverty |
| Blackfeet | 0.2 /100 | #265 | Tragic 6.2% |
| Creek | 0.2 /100 | #266 | Tragic 6.2% |
| Spanish Americans | 0.2 /100 | #267 | Tragic 6.2% |
| Alaska Natives | 0.2 /100 | #268 | Tragic 6.2% |
| Immigrants | West Indies | 0.1 /100 | #269 | Tragic 6.2% |
| Immigrants | Jamaica | 0.1 /100 | #270 | Tragic 6.2% |
| Immigrants | Bahamas | 0.1 /100 | #271 | Tragic 6.2% |
| Trinidadians and Tobagonians | 0.1 /100 | #272 | Tragic 6.2% |
| Colville | 0.1 /100 | #273 | Tragic 6.3% |
| Barbadians | 0.1 /100 | #274 | Tragic 6.3% |
| Choctaw | 0.1 /100 | #275 | Tragic 6.3% |
| Yaqui | 0.1 /100 | #276 | Tragic 6.3% |
| Indonesians | 0.1 /100 | #277 | Tragic 6.3% |
| Immigrants | Trinidad and Tobago | 0.1 /100 | #278 | Tragic 6.4% |
| Houma | 0.0 /100 | #279 | Tragic 6.4% |
Demographics Similar to Immigrants from Moldova by Married-Couple Family Poverty
In terms of married-couple family poverty, the demographic groups most similar to Immigrants from Moldova are Aleut (4.7%, a difference of 0.070%), Immigrants from France (4.7%, a difference of 0.23%), Immigrants from Germany (4.7%, a difference of 0.24%), Immigrants from Romania (4.7%, a difference of 0.34%), and Laotian (4.7%, a difference of 0.50%).
| Demographics | Rating | Rank | Married-Couple Family Poverty |
| Immigrants | Belgium | 98.2 /100 | #97 | Exceptional 4.6% |
| Native Hawaiians | 98.0 /100 | #98 | Exceptional 4.6% |
| Immigrants | Europe | 97.9 /100 | #99 | Exceptional 4.6% |
| Immigrants | Western Europe | 97.9 /100 | #100 | Exceptional 4.6% |
| Yugoslavians | 97.8 /100 | #101 | Exceptional 4.6% |
| Asians | 97.6 /100 | #102 | Exceptional 4.7% |
| Immigrants | Romania | 97.3 /100 | #103 | Exceptional 4.7% |
| Immigrants | Moldova | 97.1 /100 | #104 | Exceptional 4.7% |
| Aleuts | 97.0 /100 | #105 | Exceptional 4.7% |
| Immigrants | France | 96.9 /100 | #106 | Exceptional 4.7% |
| Immigrants | Germany | 96.8 /100 | #107 | Exceptional 4.7% |
| Laotians | 96.6 /100 | #108 | Exceptional 4.7% |
| Immigrants | Hong Kong | 96.4 /100 | #109 | Exceptional 4.7% |
| Immigrants | Bolivia | 96.2 /100 | #110 | Exceptional 4.7% |
| Pakistanis | 96.2 /100 | #111 | Exceptional 4.7% |