Portuguese vs Hmong Married-Couple Family Poverty
COMPARE
Portuguese
Hmong
Married-Couple Family Poverty
Married-Couple Family Poverty Comparison
Portuguese
Hmong
4.6%
MARRIED-COUPLE FAMILY POVERTY
98.3/ 100
METRIC RATING
95th/ 347
METRIC RANK
5.0%
MARRIED-COUPLE FAMILY POVERTY
83.2/ 100
METRIC RATING
144th/ 347
METRIC RANK
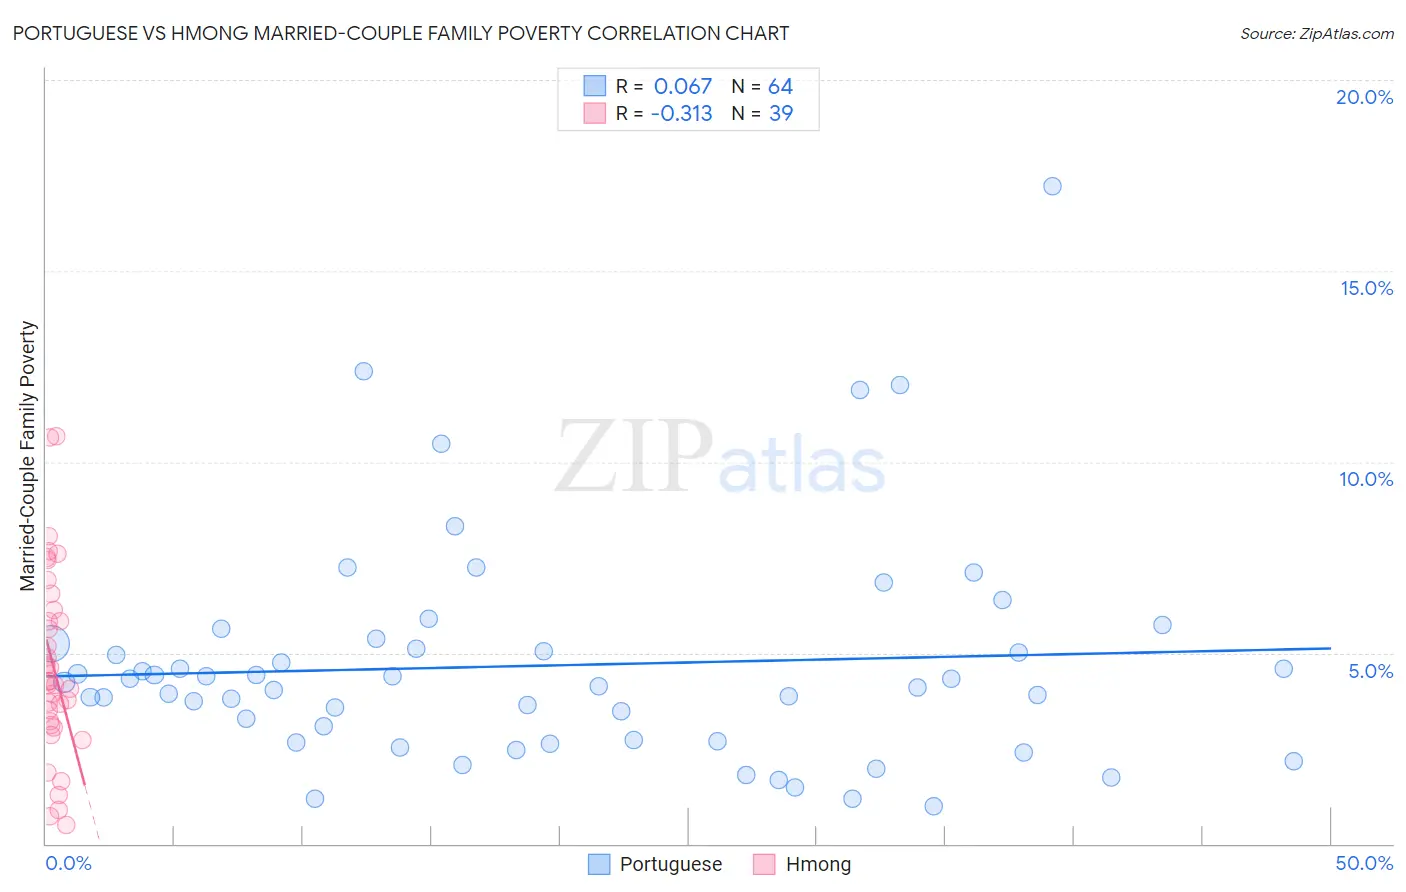
Portuguese vs Hmong Married-Couple Family Poverty Correlation Chart
The statistical analysis conducted on geographies consisting of 444,135,508 people shows a slight positive correlation between the proportion of Portuguese and poverty level among married-couple families in the United States with a correlation coefficient (R) of 0.067 and weighted average of 4.6%. Similarly, the statistical analysis conducted on geographies consisting of 24,678,157 people shows a mild negative correlation between the proportion of Hmong and poverty level among married-couple families in the United States with a correlation coefficient (R) of -0.313 and weighted average of 5.0%, a difference of 8.1%.
Married-Couple Family Poverty Correlation Summary
| Measurement | Portuguese | Hmong |
| Minimum | 0.98% | 0.50% |
| Maximum | 17.2% | 10.7% |
| Range | 16.2% | 10.2% |
| Mean | 4.7% | 4.7% |
| Median | 4.2% | 4.3% |
| Interquartile 25% (IQ1) | 2.7% | 3.1% |
| Interquartile 75% (IQ3) | 5.2% | 6.1% |
| Interquartile Range (IQR) | 2.5% | 3.0% |
| Standard Deviation (Sample) | 2.9% | 2.4% |
| Standard Deviation (Population) | 2.9% | 2.4% |
Similar Demographics by Married-Couple Family Poverty
Demographics Similar to Portuguese by Married-Couple Family Poverty
In terms of married-couple family poverty, the demographic groups most similar to Portuguese are Immigrants from Italy (4.6%, a difference of 0.040%), Immigrants from Poland (4.6%, a difference of 0.080%), Korean (4.6%, a difference of 0.090%), Immigrants from Belgium (4.6%, a difference of 0.13%), and Immigrants from Norway (4.6%, a difference of 0.27%).
| Demographics | Rating | Rank | Married-Couple Family Poverty |
| Bolivians | 98.6 /100 | #88 | Exceptional 4.6% |
| Immigrants | Czechoslovakia | 98.5 /100 | #89 | Exceptional 4.6% |
| Immigrants | Switzerland | 98.5 /100 | #90 | Exceptional 4.6% |
| Basques | 98.5 /100 | #91 | Exceptional 4.6% |
| Immigrants | Norway | 98.4 /100 | #92 | Exceptional 4.6% |
| Koreans | 98.3 /100 | #93 | Exceptional 4.6% |
| Immigrants | Italy | 98.3 /100 | #94 | Exceptional 4.6% |
| Portuguese | 98.3 /100 | #95 | Exceptional 4.6% |
| Immigrants | Poland | 98.3 /100 | #96 | Exceptional 4.6% |
| Immigrants | Belgium | 98.2 /100 | #97 | Exceptional 4.6% |
| Native Hawaiians | 98.0 /100 | #98 | Exceptional 4.6% |
| Immigrants | Europe | 97.9 /100 | #99 | Exceptional 4.6% |
| Immigrants | Western Europe | 97.9 /100 | #100 | Exceptional 4.6% |
| Yugoslavians | 97.8 /100 | #101 | Exceptional 4.6% |
| Asians | 97.6 /100 | #102 | Exceptional 4.7% |
Demographics Similar to Hmong by Married-Couple Family Poverty
In terms of married-couple family poverty, the demographic groups most similar to Hmong are Immigrants from Egypt (5.0%, a difference of 0.050%), Immigrants from Brazil (5.0%, a difference of 0.32%), Immigrants from China (5.0%, a difference of 0.32%), Immigrants from Portugal (5.0%, a difference of 0.37%), and German Russian (5.0%, a difference of 0.43%).
| Demographics | Rating | Rank | Married-Couple Family Poverty |
| Guamanians/Chamorros | 86.5 /100 | #137 | Excellent 4.9% |
| Chileans | 86.0 /100 | #138 | Excellent 4.9% |
| German Russians | 85.1 /100 | #139 | Excellent 5.0% |
| Immigrants | Portugal | 84.8 /100 | #140 | Excellent 5.0% |
| Immigrants | Brazil | 84.6 /100 | #141 | Excellent 5.0% |
| Immigrants | China | 84.6 /100 | #142 | Excellent 5.0% |
| Immigrants | Egypt | 83.4 /100 | #143 | Excellent 5.0% |
| Hmong | 83.2 /100 | #144 | Excellent 5.0% |
| Immigrants | Spain | 79.9 /100 | #145 | Good 5.0% |
| Mongolians | 79.8 /100 | #146 | Good 5.0% |
| Syrians | 78.7 /100 | #147 | Good 5.0% |
| Immigrants | Russia | 78.7 /100 | #148 | Good 5.0% |
| Immigrants | Oceania | 78.6 /100 | #149 | Good 5.0% |
| Brazilians | 78.3 /100 | #150 | Good 5.0% |
| Immigrants | Cameroon | 77.3 /100 | #151 | Good 5.0% |