Syrian vs Lumbee In Labor Force | Age 30-34
COMPARE
Syrian
Lumbee
In Labor Force | Age 30-34
In Labor Force | Age 30-34 Comparison
Syrians
Lumbee
84.8%
IN LABOR FORCE | AGE 30-34
70.1/ 100
METRIC RATING
153rd/ 347
METRIC RANK
77.3%
IN LABOR FORCE | AGE 30-34
0.0/ 100
METRIC RATING
343rd/ 347
METRIC RANK
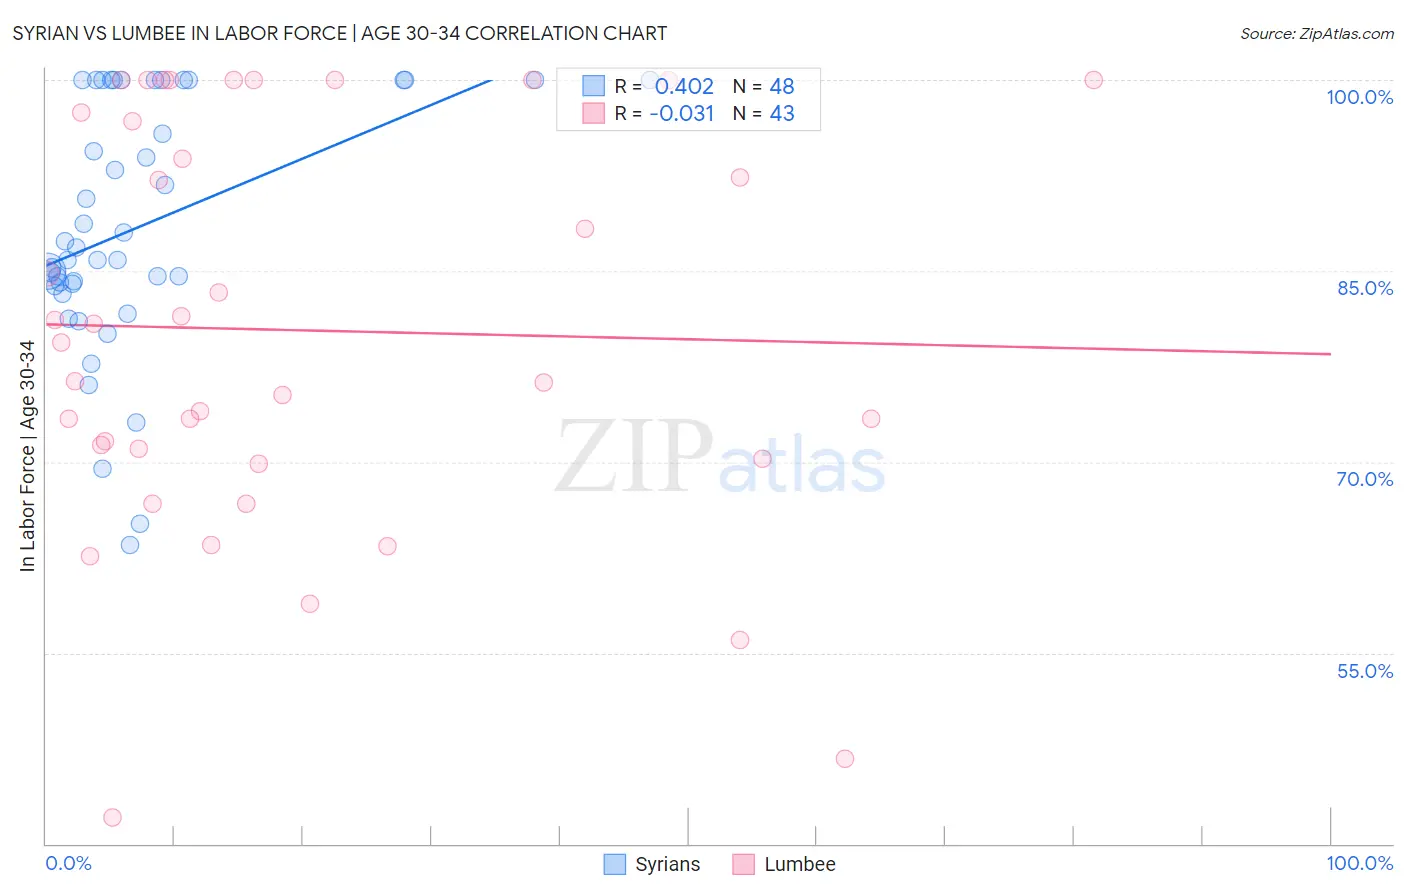
Syrian vs Lumbee In Labor Force | Age 30-34 Correlation Chart
The statistical analysis conducted on geographies consisting of 266,193,214 people shows a moderate positive correlation between the proportion of Syrians and labor force participation rate among population between the ages 30 and 34 in the United States with a correlation coefficient (R) of 0.402 and weighted average of 84.8%. Similarly, the statistical analysis conducted on geographies consisting of 92,256,461 people shows no correlation between the proportion of Lumbee and labor force participation rate among population between the ages 30 and 34 in the United States with a correlation coefficient (R) of -0.031 and weighted average of 77.3%, a difference of 9.8%.
In Labor Force | Age 30-34 Correlation Summary
| Measurement | Syrian | Lumbee |
| Minimum | 63.5% | 42.1% |
| Maximum | 100.0% | 100.0% |
| Range | 36.5% | 57.9% |
| Mean | 88.4% | 80.3% |
| Median | 86.4% | 79.4% |
| Interquartile 25% (IQ1) | 83.9% | 70.2% |
| Interquartile 75% (IQ3) | 100.0% | 97.5% |
| Interquartile Range (IQR) | 16.1% | 27.2% |
| Standard Deviation (Sample) | 9.8% | 15.9% |
| Standard Deviation (Population) | 9.7% | 15.7% |
Similar Demographics by In Labor Force | Age 30-34
Demographics Similar to Syrians by In Labor Force | Age 30-34
In terms of in labor force | age 30-34, the demographic groups most similar to Syrians are Northern European (84.8%, a difference of 0.0%), Immigrants from Sudan (84.8%, a difference of 0.0%), French Canadian (84.8%, a difference of 0.020%), Immigrants from Senegal (84.8%, a difference of 0.030%), and Romanian (84.8%, a difference of 0.030%).
| Demographics | Rating | Rank | In Labor Force | Age 30-34 |
| Immigrants | Saudi Arabia | 76.6 /100 | #146 | Good 84.9% |
| Immigrants | Colombia | 76.3 /100 | #147 | Good 84.9% |
| Immigrants | Pakistan | 76.2 /100 | #148 | Good 84.9% |
| Immigrants | Ukraine | 75.1 /100 | #149 | Good 84.8% |
| Germans | 75.1 /100 | #150 | Good 84.8% |
| Immigrants | Senegal | 74.0 /100 | #151 | Good 84.8% |
| Romanians | 73.5 /100 | #152 | Good 84.8% |
| Syrians | 70.1 /100 | #153 | Good 84.8% |
| Northern Europeans | 70.0 /100 | #154 | Good 84.8% |
| Immigrants | Sudan | 69.5 /100 | #155 | Good 84.8% |
| French Canadians | 67.3 /100 | #156 | Good 84.8% |
| Peruvians | 65.9 /100 | #157 | Good 84.8% |
| Immigrants | Armenia | 64.7 /100 | #158 | Good 84.8% |
| Czechoslovakians | 63.0 /100 | #159 | Good 84.8% |
| Pakistanis | 60.8 /100 | #160 | Good 84.7% |
Demographics Similar to Lumbee by In Labor Force | Age 30-34
In terms of in labor force | age 30-34, the demographic groups most similar to Lumbee are Yuman (77.1%, a difference of 0.23%), Tohono O'odham (77.7%, a difference of 0.60%), Yup'ik (76.4%, a difference of 1.1%), Immigrants from Yemen (78.2%, a difference of 1.2%), and Crow (75.9%, a difference of 1.8%).
| Demographics | Rating | Rank | In Labor Force | Age 30-34 |
| Inupiat | 0.0 /100 | #333 | Tragic 79.7% |
| Hopi | 0.0 /100 | #334 | Tragic 79.3% |
| Marshallese | 0.0 /100 | #335 | Tragic 79.2% |
| Natives/Alaskans | 0.0 /100 | #336 | Tragic 79.2% |
| Yakama | 0.0 /100 | #337 | Tragic 79.1% |
| Pima | 0.0 /100 | #338 | Tragic 79.0% |
| Apache | 0.0 /100 | #339 | Tragic 79.0% |
| Ute | 0.0 /100 | #340 | Tragic 78.9% |
| Immigrants | Yemen | 0.0 /100 | #341 | Tragic 78.2% |
| Tohono O'odham | 0.0 /100 | #342 | Tragic 77.7% |
| Lumbee | 0.0 /100 | #343 | Tragic 77.3% |
| Yuman | 0.0 /100 | #344 | Tragic 77.1% |
| Yup'ik | 0.0 /100 | #345 | Tragic 76.4% |
| Crow | 0.0 /100 | #346 | Tragic 75.9% |
| Navajo | 0.0 /100 | #347 | Tragic 73.8% |