Scottish vs Pima Female Poverty
COMPARE
Scottish
Pima
Female Poverty
Female Poverty Comparison
Scottish
Pima
12.5%
FEMALE POVERTY
94.1/ 100
METRIC RATING
105th/ 347
METRIC RANK
23.6%
FEMALE POVERTY
0.0/ 100
METRIC RATING
344th/ 347
METRIC RANK
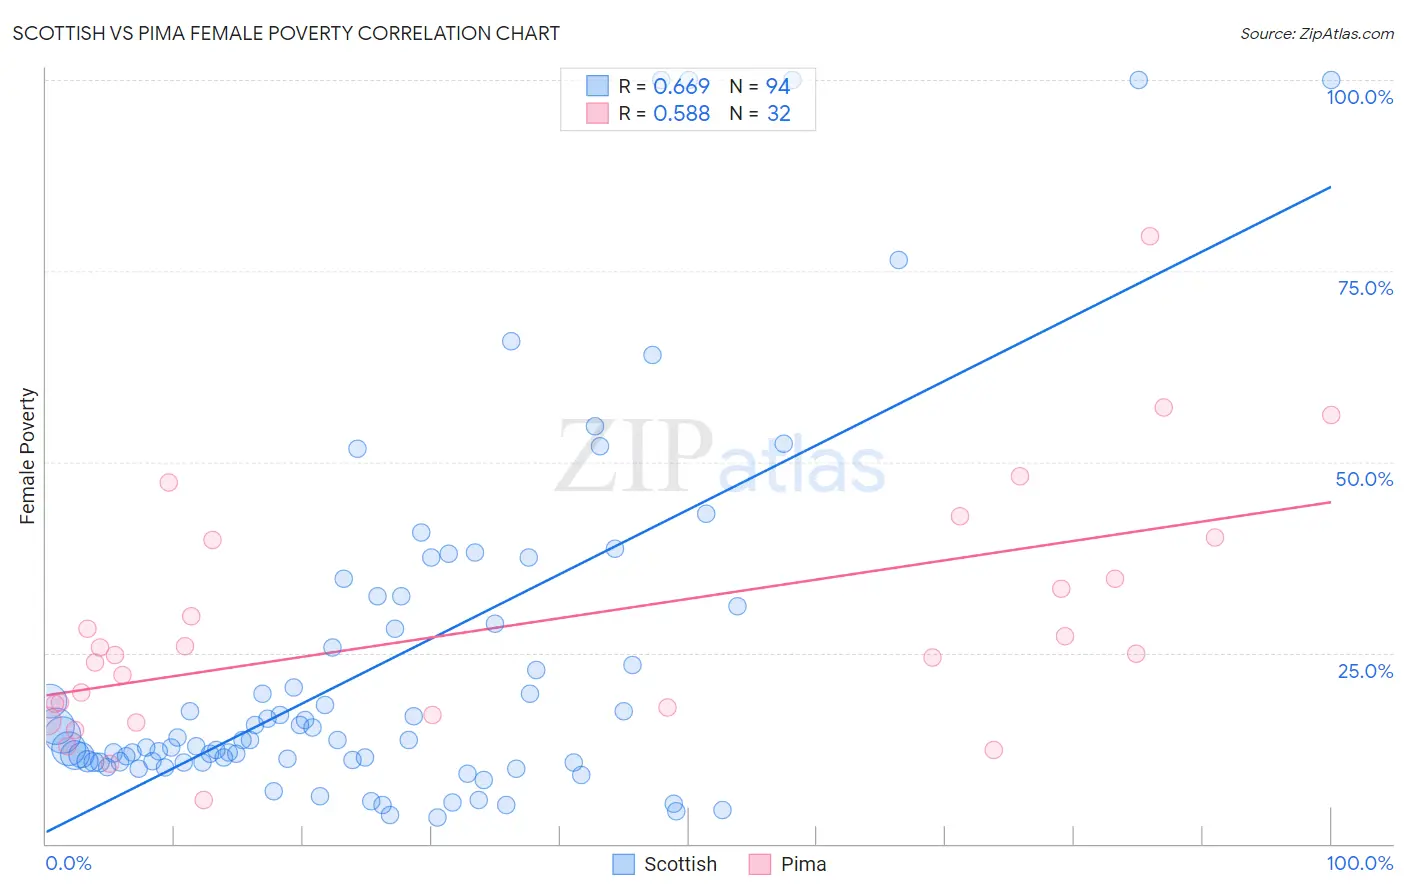
Scottish vs Pima Female Poverty Correlation Chart
The statistical analysis conducted on geographies consisting of 565,877,668 people shows a significant positive correlation between the proportion of Scottish and poverty level among females in the United States with a correlation coefficient (R) of 0.669 and weighted average of 12.5%. Similarly, the statistical analysis conducted on geographies consisting of 61,538,212 people shows a substantial positive correlation between the proportion of Pima and poverty level among females in the United States with a correlation coefficient (R) of 0.588 and weighted average of 23.6%, a difference of 87.9%.
Female Poverty Correlation Summary
| Measurement | Scottish | Pima |
| Minimum | 3.5% | 5.7% |
| Maximum | 100.0% | 79.5% |
| Range | 96.5% | 73.8% |
| Mean | 23.6% | 28.6% |
| Median | 13.6% | 24.8% |
| Interquartile 25% (IQ1) | 10.7% | 17.3% |
| Interquartile 75% (IQ3) | 28.8% | 37.2% |
| Interquartile Range (IQR) | 18.1% | 19.9% |
| Standard Deviation (Sample) | 23.5% | 16.0% |
| Standard Deviation (Population) | 23.4% | 15.8% |
Similar Demographics by Female Poverty
Demographics Similar to Scottish by Female Poverty
In terms of female poverty, the demographic groups most similar to Scottish are Palestinian (12.5%, a difference of 0.11%), Immigrants from Turkey (12.6%, a difference of 0.12%), Slavic (12.5%, a difference of 0.20%), Immigrants from China (12.5%, a difference of 0.22%), and Laotian (12.6%, a difference of 0.31%).
| Demographics | Rating | Rank | Female Poverty |
| Native Hawaiians | 95.1 /100 | #98 | Exceptional 12.5% |
| Romanians | 95.1 /100 | #99 | Exceptional 12.5% |
| Immigrants | Latvia | 94.8 /100 | #100 | Exceptional 12.5% |
| Tlingit-Haida | 94.8 /100 | #101 | Exceptional 12.5% |
| Immigrants | China | 94.5 /100 | #102 | Exceptional 12.5% |
| Slavs | 94.5 /100 | #103 | Exceptional 12.5% |
| Palestinians | 94.3 /100 | #104 | Exceptional 12.5% |
| Scottish | 94.1 /100 | #105 | Exceptional 12.5% |
| Immigrants | Turkey | 93.8 /100 | #106 | Exceptional 12.6% |
| Laotians | 93.4 /100 | #107 | Exceptional 12.6% |
| Portuguese | 93.1 /100 | #108 | Exceptional 12.6% |
| Immigrants | Zimbabwe | 93.1 /100 | #109 | Exceptional 12.6% |
| Paraguayans | 93.0 /100 | #110 | Exceptional 12.6% |
| Soviet Union | 92.4 /100 | #111 | Exceptional 12.6% |
| Immigrants | Israel | 92.0 /100 | #112 | Exceptional 12.6% |
Demographics Similar to Pima by Female Poverty
In terms of female poverty, the demographic groups most similar to Pima are Lumbee (23.5%, a difference of 0.31%), Navajo (23.9%, a difference of 1.3%), Immigrants from Yemen (22.8%, a difference of 3.3%), Crow (22.1%, a difference of 6.5%), and Puerto Rican (25.2%, a difference of 6.8%).
| Demographics | Rating | Rank | Female Poverty |
| Immigrants | Dominican Republic | 0.0 /100 | #333 | Tragic 19.3% |
| Houma | 0.0 /100 | #334 | Tragic 20.0% |
| Cheyenne | 0.0 /100 | #335 | Tragic 20.2% |
| Pueblo | 0.0 /100 | #336 | Tragic 20.7% |
| Yuman | 0.0 /100 | #337 | Tragic 20.8% |
| Sioux | 0.0 /100 | #338 | Tragic 20.9% |
| Hopi | 0.0 /100 | #339 | Tragic 21.0% |
| Yup'ik | 0.0 /100 | #340 | Tragic 21.5% |
| Crow | 0.0 /100 | #341 | Tragic 22.1% |
| Immigrants | Yemen | 0.0 /100 | #342 | Tragic 22.8% |
| Lumbee | 0.0 /100 | #343 | Tragic 23.5% |
| Pima | 0.0 /100 | #344 | Tragic 23.6% |
| Navajo | 0.0 /100 | #345 | Tragic 23.9% |
| Puerto Ricans | 0.0 /100 | #346 | Tragic 25.2% |
| Tohono O'odham | 0.0 /100 | #347 | Tragic 25.9% |