Scottish vs Immigrants from Netherlands Female Poverty
COMPARE
Scottish
Immigrants from Netherlands
Female Poverty
Female Poverty Comparison
Scottish
Immigrants from Netherlands
12.5%
FEMALE POVERTY
94.1/ 100
METRIC RATING
105th/ 347
METRIC RANK
12.2%
FEMALE POVERTY
97.8/ 100
METRIC RATING
68th/ 347
METRIC RANK
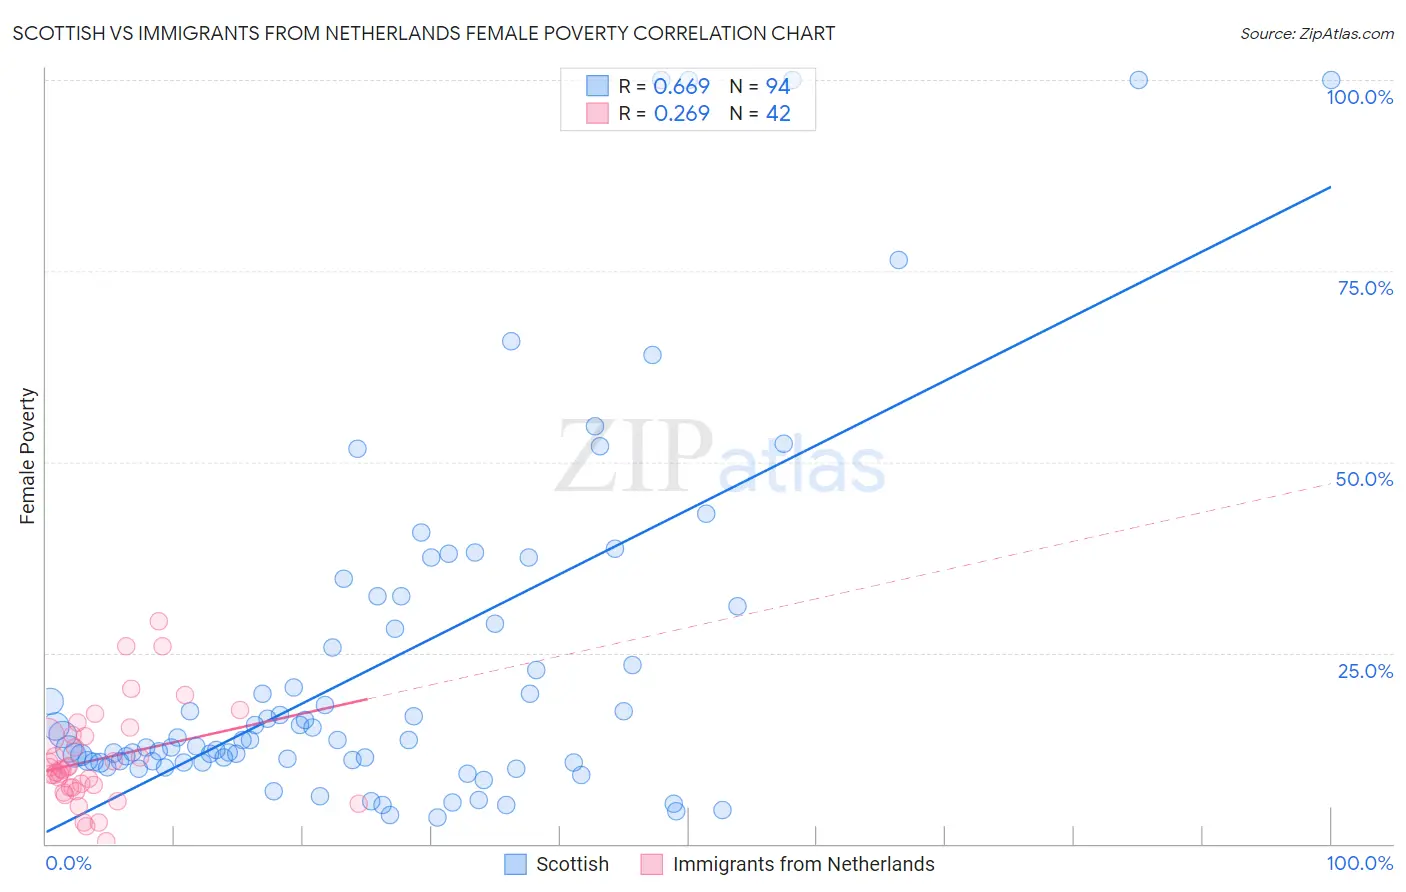
Scottish vs Immigrants from Netherlands Female Poverty Correlation Chart
The statistical analysis conducted on geographies consisting of 565,877,668 people shows a significant positive correlation between the proportion of Scottish and poverty level among females in the United States with a correlation coefficient (R) of 0.669 and weighted average of 12.5%. Similarly, the statistical analysis conducted on geographies consisting of 237,788,507 people shows a weak positive correlation between the proportion of Immigrants from Netherlands and poverty level among females in the United States with a correlation coefficient (R) of 0.269 and weighted average of 12.2%, a difference of 2.7%.
Female Poverty Correlation Summary
| Measurement | Scottish | Immigrants from Netherlands |
| Minimum | 3.5% | 0.30% |
| Maximum | 100.0% | 29.1% |
| Range | 96.5% | 28.8% |
| Mean | 23.6% | 11.0% |
| Median | 13.6% | 9.7% |
| Interquartile 25% (IQ1) | 10.7% | 7.4% |
| Interquartile 75% (IQ3) | 28.8% | 14.1% |
| Interquartile Range (IQR) | 18.1% | 6.7% |
| Standard Deviation (Sample) | 23.5% | 6.3% |
| Standard Deviation (Population) | 23.4% | 6.2% |
Similar Demographics by Female Poverty
Demographics Similar to Scottish by Female Poverty
In terms of female poverty, the demographic groups most similar to Scottish are Palestinian (12.5%, a difference of 0.11%), Immigrants from Turkey (12.6%, a difference of 0.12%), Slavic (12.5%, a difference of 0.20%), Immigrants from China (12.5%, a difference of 0.22%), and Laotian (12.6%, a difference of 0.31%).
| Demographics | Rating | Rank | Female Poverty |
| Native Hawaiians | 95.1 /100 | #98 | Exceptional 12.5% |
| Romanians | 95.1 /100 | #99 | Exceptional 12.5% |
| Immigrants | Latvia | 94.8 /100 | #100 | Exceptional 12.5% |
| Tlingit-Haida | 94.8 /100 | #101 | Exceptional 12.5% |
| Immigrants | China | 94.5 /100 | #102 | Exceptional 12.5% |
| Slavs | 94.5 /100 | #103 | Exceptional 12.5% |
| Palestinians | 94.3 /100 | #104 | Exceptional 12.5% |
| Scottish | 94.1 /100 | #105 | Exceptional 12.5% |
| Immigrants | Turkey | 93.8 /100 | #106 | Exceptional 12.6% |
| Laotians | 93.4 /100 | #107 | Exceptional 12.6% |
| Portuguese | 93.1 /100 | #108 | Exceptional 12.6% |
| Immigrants | Zimbabwe | 93.1 /100 | #109 | Exceptional 12.6% |
| Paraguayans | 93.0 /100 | #110 | Exceptional 12.6% |
| Soviet Union | 92.4 /100 | #111 | Exceptional 12.6% |
| Immigrants | Israel | 92.0 /100 | #112 | Exceptional 12.6% |
Demographics Similar to Immigrants from Netherlands by Female Poverty
In terms of female poverty, the demographic groups most similar to Immigrants from Netherlands are Immigrants from Eastern Asia (12.2%, a difference of 0.040%), Swiss (12.2%, a difference of 0.10%), Immigrants from Belgium (12.2%, a difference of 0.13%), Austrian (12.2%, a difference of 0.17%), and Indian (Asian) (12.2%, a difference of 0.18%).
| Demographics | Rating | Rank | Female Poverty |
| Immigrants | Asia | 98.1 /100 | #61 | Exceptional 12.2% |
| Immigrants | Italy | 98.0 /100 | #62 | Exceptional 12.2% |
| Ukrainians | 98.0 /100 | #63 | Exceptional 12.2% |
| Germans | 98.0 /100 | #64 | Exceptional 12.2% |
| Indians (Asian) | 97.9 /100 | #65 | Exceptional 12.2% |
| Austrians | 97.9 /100 | #66 | Exceptional 12.2% |
| Immigrants | Eastern Asia | 97.8 /100 | #67 | Exceptional 12.2% |
| Immigrants | Netherlands | 97.8 /100 | #68 | Exceptional 12.2% |
| Swiss | 97.7 /100 | #69 | Exceptional 12.2% |
| Immigrants | Belgium | 97.7 /100 | #70 | Exceptional 12.2% |
| Carpatho Rusyns | 97.6 /100 | #71 | Exceptional 12.2% |
| Cambodians | 97.5 /100 | #72 | Exceptional 12.2% |
| Zimbabweans | 97.5 /100 | #73 | Exceptional 12.3% |
| Immigrants | Canada | 97.5 /100 | #74 | Exceptional 12.3% |
| Europeans | 97.4 /100 | #75 | Exceptional 12.3% |