Scottish vs Immigrants from Hong Kong Female Poverty
COMPARE
Scottish
Immigrants from Hong Kong
Female Poverty
Female Poverty Comparison
Scottish
Immigrants from Hong Kong
12.5%
FEMALE POVERTY
94.1/ 100
METRIC RATING
105th/ 347
METRIC RANK
11.2%
FEMALE POVERTY
99.9/ 100
METRIC RATING
10th/ 347
METRIC RANK
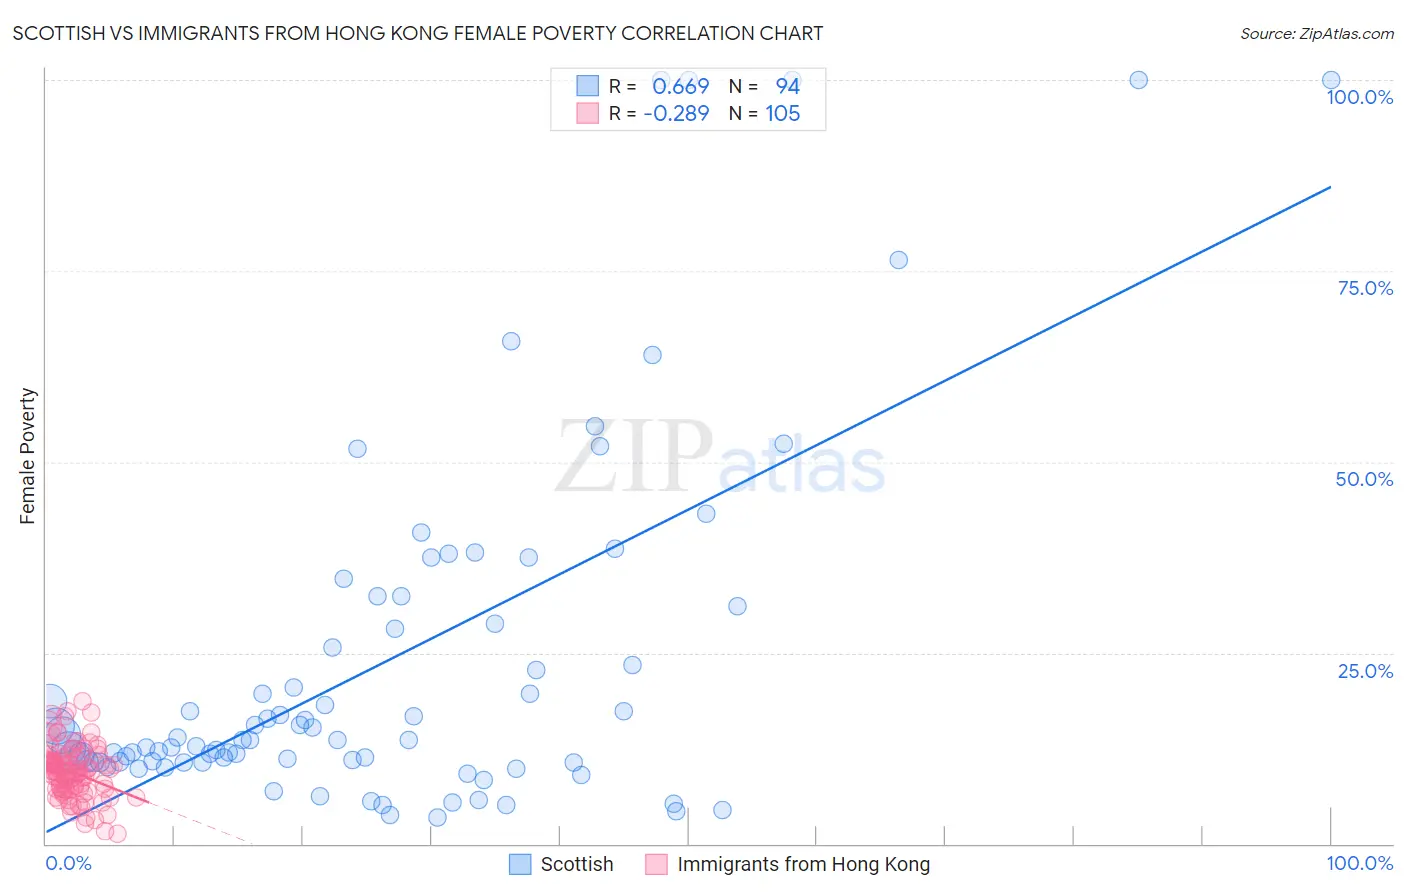
Scottish vs Immigrants from Hong Kong Female Poverty Correlation Chart
The statistical analysis conducted on geographies consisting of 565,877,668 people shows a significant positive correlation between the proportion of Scottish and poverty level among females in the United States with a correlation coefficient (R) of 0.669 and weighted average of 12.5%. Similarly, the statistical analysis conducted on geographies consisting of 253,845,930 people shows a weak negative correlation between the proportion of Immigrants from Hong Kong and poverty level among females in the United States with a correlation coefficient (R) of -0.289 and weighted average of 11.2%, a difference of 11.8%.
Female Poverty Correlation Summary
| Measurement | Scottish | Immigrants from Hong Kong |
| Minimum | 3.5% | 1.3% |
| Maximum | 100.0% | 18.6% |
| Range | 96.5% | 17.3% |
| Mean | 23.6% | 9.4% |
| Median | 13.6% | 9.5% |
| Interquartile 25% (IQ1) | 10.7% | 7.2% |
| Interquartile 75% (IQ3) | 28.8% | 10.9% |
| Interquartile Range (IQR) | 18.1% | 3.7% |
| Standard Deviation (Sample) | 23.5% | 3.4% |
| Standard Deviation (Population) | 23.4% | 3.4% |
Similar Demographics by Female Poverty
Demographics Similar to Scottish by Female Poverty
In terms of female poverty, the demographic groups most similar to Scottish are Palestinian (12.5%, a difference of 0.11%), Immigrants from Turkey (12.6%, a difference of 0.12%), Slavic (12.5%, a difference of 0.20%), Immigrants from China (12.5%, a difference of 0.22%), and Laotian (12.6%, a difference of 0.31%).
| Demographics | Rating | Rank | Female Poverty |
| Native Hawaiians | 95.1 /100 | #98 | Exceptional 12.5% |
| Romanians | 95.1 /100 | #99 | Exceptional 12.5% |
| Immigrants | Latvia | 94.8 /100 | #100 | Exceptional 12.5% |
| Tlingit-Haida | 94.8 /100 | #101 | Exceptional 12.5% |
| Immigrants | China | 94.5 /100 | #102 | Exceptional 12.5% |
| Slavs | 94.5 /100 | #103 | Exceptional 12.5% |
| Palestinians | 94.3 /100 | #104 | Exceptional 12.5% |
| Scottish | 94.1 /100 | #105 | Exceptional 12.5% |
| Immigrants | Turkey | 93.8 /100 | #106 | Exceptional 12.6% |
| Laotians | 93.4 /100 | #107 | Exceptional 12.6% |
| Portuguese | 93.1 /100 | #108 | Exceptional 12.6% |
| Immigrants | Zimbabwe | 93.1 /100 | #109 | Exceptional 12.6% |
| Paraguayans | 93.0 /100 | #110 | Exceptional 12.6% |
| Soviet Union | 92.4 /100 | #111 | Exceptional 12.6% |
| Immigrants | Israel | 92.0 /100 | #112 | Exceptional 12.6% |
Demographics Similar to Immigrants from Hong Kong by Female Poverty
In terms of female poverty, the demographic groups most similar to Immigrants from Hong Kong are Maltese (11.2%, a difference of 0.11%), Bhutanese (11.3%, a difference of 0.57%), Immigrants from Lithuania (11.3%, a difference of 0.58%), Bulgarian (11.1%, a difference of 0.80%), and Immigrants from South Central Asia (11.1%, a difference of 0.99%).
| Demographics | Rating | Rank | Female Poverty |
| Thais | 100.0 /100 | #3 | Exceptional 10.5% |
| Immigrants | Taiwan | 100.0 /100 | #4 | Exceptional 10.5% |
| Filipinos | 100.0 /100 | #5 | Exceptional 10.9% |
| Immigrants | Ireland | 99.9 /100 | #6 | Exceptional 11.0% |
| Assyrians/Chaldeans/Syriacs | 99.9 /100 | #7 | Exceptional 11.0% |
| Immigrants | South Central Asia | 99.9 /100 | #8 | Exceptional 11.1% |
| Bulgarians | 99.9 /100 | #9 | Exceptional 11.1% |
| Immigrants | Hong Kong | 99.9 /100 | #10 | Exceptional 11.2% |
| Maltese | 99.9 /100 | #11 | Exceptional 11.2% |
| Bhutanese | 99.9 /100 | #12 | Exceptional 11.3% |
| Immigrants | Lithuania | 99.9 /100 | #13 | Exceptional 11.3% |
| Lithuanians | 99.8 /100 | #14 | Exceptional 11.4% |
| Latvians | 99.8 /100 | #15 | Exceptional 11.4% |
| Immigrants | Bolivia | 99.8 /100 | #16 | Exceptional 11.5% |
| Bolivians | 99.8 /100 | #17 | Exceptional 11.5% |